
Figures & data
Figure 1. Structure of the σ finger in the principal and alternative σ factors in E. coli. (A-E) Structures of promoter complexes formed by RNAP holoenzymes containing the principal and alternative σ factors: σ70 (A, PDB 4YLO [Citation25]), σ70 with DksA and ppGpp (G4P) (B, PDB:5VSW [Citation55]), σ38 (C, PDB:5IPL [Citation34]), σ28 (D, PDB 6PMI [Citation38], σ24 (E, PDB 6JBQ [Citation35]). The σ factor is shown in ochre, the σ finger (region 3.2) is orange, deletions in the σ finger analysed in this study are brown. The template DNA strand (T) is light blue, the nontemplate DNA strand (NT) is dark blue, the RNA primer is black, the bridge helix (BH) is green, magnesium ions (Mg) bound in the active site are magenta. (F) Scheme of transcription initiation. Changes in the σ finger during RNA priming are indicated with arrows. (G) Sequences of the σ finger (shown in the orange box, corresponding to the region highlighted in orange in panels A-E) in the principal and alternative σs in E. coli. Deleted amino acid residues are shown in bold. Position of the σ finger in σ24 is based on the published structure of the RNAP σ24 holoenzyme [Citation35]
![Figure 1. Structure of the σ finger in the principal and alternative σ factors in E. coli. (A-E) Structures of promoter complexes formed by RNAP holoenzymes containing the principal and alternative σ factors: σ70 (A, PDB 4YLO [Citation25]), σ70 with DksA and ppGpp (G4P) (B, PDB:5VSW [Citation55]), σ38 (C, PDB:5IPL [Citation34]), σ28 (D, PDB 6PMI [Citation38], σ24 (E, PDB 6JBQ [Citation35]). The σ factor is shown in ochre, the σ finger (region 3.2) is orange, deletions in the σ finger analysed in this study are brown. The template DNA strand (T) is light blue, the nontemplate DNA strand (NT) is dark blue, the RNA primer is black, the bridge helix (BH) is green, magnesium ions (Mg) bound in the active site are magenta. (F) Scheme of transcription initiation. Changes in the σ finger during RNA priming are indicated with arrows. (G) Sequences of the σ finger (shown in the orange box, corresponding to the region highlighted in orange in panels A-E) in the principal and alternative σs in E. coli. Deleted amino acid residues are shown in bold. Position of the σ finger in σ24 is based on the published structure of the RNAP σ24 holoenzyme [Citation35]](/cms/asset/8dde47c4-9746-40a9-b9b8-bc6833d0558d/krnb_a_1889254_f0001_oc.jpg)
Figure 2. Transcription initiation by RNAP holoenzymes containing alternative σ factors with deletions in the σ finger. (A) σ38 on the adhEp1 promoter. (B) σ38 on the dnaKp1 promoter. (C) σ38 on the flgMp promoter. (D) σ24 on the yieEp promoter. The reactions contained high (200 μM ATP, GTP, CTP and 10 μM UTP) or low (30 μM ATP, GTP, CTP and 10 μM UTP) nucleotide concentrations. Primers added to the reactions are indicated as X (dinucleotide primers corresponding to each promoter, Fig. S1) and N (NADH). For each RNAP, RNA products were separated in one or two parallel polyacrylamide gel of different densities (15 and 23%) for analysis of abortive products (AP) and full-length (RO, run-off) RNA products. Positions of full length products initiated in the absence (A) or in the presence of NADH are indicated. For most promoters, additional RNA products observed below the RO product likely correspond to RNAP stalling before the end of the linear DNA fragment (see Fig. S3). The marker (M) lanes contain abortive RNA products of known lengths synthesized during transcription by the σ70 RNAP holoenzyme on the T7A1cons promoter [Citation43]. RNAP activities calculated in percent of full-length RNA products relative to the wild-type RNAP are indicated below the gels (means from 2 independent measurements). The scanning profiles of full-length and short RNA products synthesized in reactions performed at high nucleotide concentrations (lanes 1,2 and 7,8 in each panel) are shown on the right in each panel. The profiles were drawn for reactions separated on the same gel and were normalized to the level of RO synthesis. The ratio of RO RNA to the sum of short RNA products (indicated in the profiles) in the same reactions is shown at the bottom
![Figure 2. Transcription initiation by RNAP holoenzymes containing alternative σ factors with deletions in the σ finger. (A) σ38 on the adhEp1 promoter. (B) σ38 on the dnaKp1 promoter. (C) σ38 on the flgMp promoter. (D) σ24 on the yieEp promoter. The reactions contained high (200 μM ATP, GTP, CTP and 10 μM UTP) or low (30 μM ATP, GTP, CTP and 10 μM UTP) nucleotide concentrations. Primers added to the reactions are indicated as X (dinucleotide primers corresponding to each promoter, Fig. S1) and N (NADH). For each RNAP, RNA products were separated in one or two parallel polyacrylamide gel of different densities (15 and 23%) for analysis of abortive products (AP) and full-length (RO, run-off) RNA products. Positions of full length products initiated in the absence (A) or in the presence of NADH are indicated. For most promoters, additional RNA products observed below the RO product likely correspond to RNAP stalling before the end of the linear DNA fragment (see Fig. S3). The marker (M) lanes contain abortive RNA products of known lengths synthesized during transcription by the σ70 RNAP holoenzyme on the T7A1cons promoter [Citation43]. RNAP activities calculated in percent of full-length RNA products relative to the wild-type RNAP are indicated below the gels (means from 2 independent measurements). The scanning profiles of full-length and short RNA products synthesized in reactions performed at high nucleotide concentrations (lanes 1,2 and 7,8 in each panel) are shown on the right in each panel. The profiles were drawn for reactions separated on the same gel and were normalized to the level of RO synthesis. The ratio of RO RNA to the sum of short RNA products (indicated in the profiles) in the same reactions is shown at the bottom](/cms/asset/a926786b-d571-4e6f-abf6-ac172497c9c1/krnb_a_1889254_f0002_oc.jpg)
Figure 3. Effects of DksA and ppGpp on the activity of RNAP holoenzymes containing wild-type and mutant σ factors. For each σ factor, wild-type or mutant, transcription was performed in the absence or in the presence of DksA and ppGpp and normalized to the activity in the absence of regulators (see Materials and Methods for details). Means and standard deviations from four independent measurements are shown. Significant differences in activities are shown with brackets above the plots (p-values < 0.05)
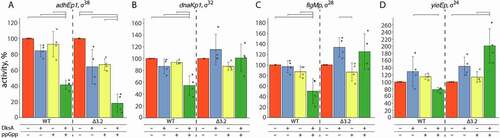
Table 1. Promoter complex half-life times for RNAP holoenzymes containing wild-type and mutant σ factors, in the absence and in the presence of DksA and ppGpp
Figure 4. Stabilities of promoter complexes formed by wild-type and mutant σ factors in the absence and in the presence of DksA/ppGpp. Preformed promoter complexes were incubated for increasing time intervals with heparin, followed by the addition of NTPs (in the control samples heparin was added together with NTPs). Positions of the run-off RNA transcripts are indicated. The plots show the kinetics of the decay of RNAP activity (averages from 3–4 independent experiments). The data were fitted to a single-exponential equation. The half-life times for each promoter complex are shown in
