
Figures & data
Figure 1. Overview of RsmA/N CLIP-seq. (A) Representative figures of western blotting (top) and autoradiogram (bottom) of the CLIP-enriched RsmA/N-RNA complexes. XL+: crosslinking, XL-: non-crosslinking. (B) Graphical summary of nonRI CLIP-seq approach. (C) The distribution of RsmA/N binding sites across the P. aeruginosa genome. Peaks from RsmA and RsmN CLIP-seq are highlighted in blue and red, respectively. (D) Overlapping peaks (top) and genes (bottom) between RsmA and RsmN bindings. Two peaks from both RBPs wherein both the start and stop positions are within 40 nt were considered as the same peak. (E) Classification of RsmA/N peaks into RNA classes (5ʹ UTR, CDS, 3ʹ UTR, sRNA, tRNA, rRNA, and Intergenic peaks). Note that a peak may be classified into multiple classes based on its position
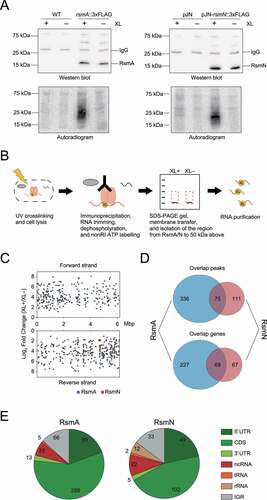
Figure 2. Consensus motif for P. aeruginosa RsmA/N bindings. (A) Meta-gene analysis for RsmA/N bindings along mRNAs with start and stop codons as the reference points. (B) MEME sequence motif analysis for all RsmA (411) and RsmN (186) peaks. The numbers indicate the peaks containing predicted sequence motifs. (C) Percentage of peaks with indicated sequences. (D) CMfinder structural motif analysis of all RsmA (411) and RsmN (186) peak sequences extended with 10 nt upstream and downstream. Top-ranked structural motifs are shown. (E) Percentage of peaks with the indicated number of GGA sequence per peak sequence extended with 10 nt upstream and downstream
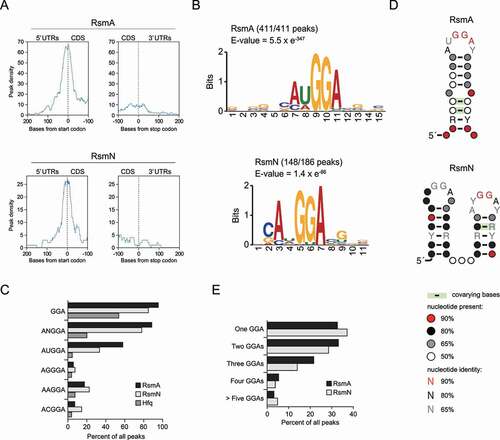
Figure 3. RsmA/N CLIP-seq captures previously known RsmA/N-binding sites. (A) Read coverage from RsmA/N at the sRNAs RsmY/Z loci. Vertical axis indicates each read count. XL+: crosslinking, XL-: non-crosslinking. (B) Secondary structures of sRNAs RsmY/Z predicted by Mfold [Citation54]. Red and shaded letters indicate RsmA/N and Hfq binding peaks, respectively. Bold letters indicate GGA sequence as a common binding motif of RsmA/N. (C) Read coverage at the tssA1 and mucA loci from RsmA/N CLIP-seq are indicated. (D) Secondary structures of RsmA/N binding sites at the tssA1 and mucA were predicted using Mfold [Citation54]. Red letters indicate GGA sequence as a common binding motif of RsmA/N
![Figure 3. RsmA/N CLIP-seq captures previously known RsmA/N-binding sites. (A) Read coverage from RsmA/N at the sRNAs RsmY/Z loci. Vertical axis indicates each read count. XL+: crosslinking, XL-: non-crosslinking. (B) Secondary structures of sRNAs RsmY/Z predicted by Mfold [Citation54]. Red and shaded letters indicate RsmA/N and Hfq binding peaks, respectively. Bold letters indicate GGA sequence as a common binding motif of RsmA/N. (C) Read coverage at the tssA1 and mucA loci from RsmA/N CLIP-seq are indicated. (D) Secondary structures of RsmA/N binding sites at the tssA1 and mucA were predicted using Mfold [Citation54]. Red letters indicate GGA sequence as a common binding motif of RsmA/N](/cms/asset/2d27130d-c498-4227-a357-e25e3c91f45d/krnb_a_1917184_f0003_oc.jpg)
Figure 4. The wbp gene cluster is post-transcriptionally regulated by RsmA/N. (A) DAVID enrichment analysis of RsmA/N peaks. The results of biological process are presented. (B) RsmA/N peak density distribution along the P. aeruginosa chromosome in bins of 2 × 10⁴ basepairs. (C) Read coverage at the wbp gene cluster from RsmA/N CLIP-seq. TSS annotations (black arrows) were derived from a previous study [Citation39]. Vertical axis indicates each read count. RsmA and RsmN-binding peaks with significant enrichment (FDR < 0.05) are indicated as red and blue bars, respectively. The genes shown in red were used for the following translational fusion assay. (D) Super-folder GFP translational fusion assay for the indicated genes between wild type and rsmAN mutant. Welch’s t-test results are indicated: N.S., not significant; *, p-value < 0.05; **, p-value < 0.01; ***, p-value < 0.001. The reported values with the standard error represent the average of three independent experiments
![Figure 4. The wbp gene cluster is post-transcriptionally regulated by RsmA/N. (A) DAVID enrichment analysis of RsmA/N peaks. The results of biological process are presented. (B) RsmA/N peak density distribution along the P. aeruginosa chromosome in bins of 2 × 10⁴ basepairs. (C) Read coverage at the wbp gene cluster from RsmA/N CLIP-seq. TSS annotations (black arrows) were derived from a previous study [Citation39]. Vertical axis indicates each read count. RsmA and RsmN-binding peaks with significant enrichment (FDR < 0.05) are indicated as red and blue bars, respectively. The genes shown in red were used for the following translational fusion assay. (D) Super-folder GFP translational fusion assay for the indicated genes between wild type and rsmAN mutant. Welch’s t-test results are indicated: N.S., not significant; *, p-value < 0.05; **, p-value < 0.01; ***, p-value < 0.001. The reported values with the standard error represent the average of three independent experiments](/cms/asset/8178331d-a40d-4ec5-84f1-945a30876da0/krnb_a_1917184_f0004_oc.jpg)
Figure 5. RsmA/N-controlled feedback loop for RsmY/Z sRNAs expressions. (A) Graphical summary of RsmA/N bindings with GacAS regulatory network. Orange and purple ovals are membrane-bound histidine kinases and response regulators in two-component systems, respectively. Asterisks indicate that RsmA/N peaks are associated with the genes. (B) Read coverage at the cafA and hptB loci from RsmA/N CLIP-seq. Vertical axis indicates each read count. RsmN-binding peaks with significant enrichment (FDR < 0.05) are indicated as red bars. (C) Super-folder GFP translational fusion assay for the indicated genes between wild type and rsmAN mutant. (D) Super-folder GFP translational fusion assay for the indicated genes in rsmAN mutant with indicated plasmids. For exogenous RsmA/N expressions, 0.1% arabinose was added. (E) Relative expressions of RsmY/Z in PAO1 wild type and ΔrsmA/N. RNA was extracted from cultures at OD600 = 2.0 and RsmY/Z abundances were quantified by qRT-PCR. Welch’s t-test results are indicated: *, p-value < 0.05; **, p-value < 0.01; ***, p-value < 0.001 (C and E) and One-way ANOVA and Tukey’s HSD test results are indicated: **, p-value < 0.01; N.S., not significant (D). The reported values with the standard error represent the average of three independent experiments
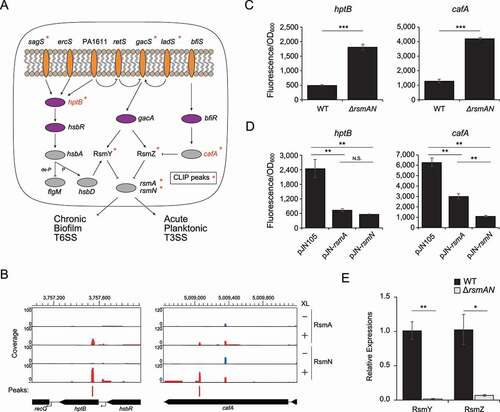
Figure 6. SPA0079 does not titrate RsmA/N under our conditions (A) Read coverage at the SPA0079 locus from RsmA/N CLIP-seq. Vertical axis indicates each read count. XL+: crosslinking, XL-: non-crosslinking. (B) Secondary structure of SPA0079 in P. aeruginosa PAO1 predicted by Mfold [Citation54]. Red letters indicate AUGGA sequence as a common binding motif of RsmA/N. (C) Super-folder GFP translational fusion assay for cafA gene between pJNS105 control vector and pJNS-SPA0079 overexpression vector. For exogenous SPA0079 expression, 0.1% arabinose was added. The reported values represent the average of three independent experiments and the standard error
![Figure 6. SPA0079 does not titrate RsmA/N under our conditions (A) Read coverage at the SPA0079 locus from RsmA/N CLIP-seq. Vertical axis indicates each read count. XL+: crosslinking, XL-: non-crosslinking. (B) Secondary structure of SPA0079 in P. aeruginosa PAO1 predicted by Mfold [Citation54]. Red letters indicate AUGGA sequence as a common binding motif of RsmA/N. (C) Super-folder GFP translational fusion assay for cafA gene between pJNS105 control vector and pJNS-SPA0079 overexpression vector. For exogenous SPA0079 expression, 0.1% arabinose was added. The reported values represent the average of three independent experiments and the standard error](/cms/asset/937a2ab2-733e-4f5e-b3e7-c65f8e5af7f6/krnb_a_1917184_f0006_oc.jpg)
Supplemental Material
Download Zip (5.5 MB)Data availability statement
Raw sequence data are available in the DDBJ Sequenced Read Archive (https://www.ddbj.nig.ac.jp/dra/index-e.html) under the accession number DRA010307.