Figures & data
Figure 1. Selection of a primer pair for SARS-CoV-2 detection. (A) Serial dilutions of a pool of positive samples for each primer pair. Representative amplification (left panel) and melting curves (middle panel) are shown. Corresponding RT-qPCR products were solved by gel electrophoresis and representative images of positive samples (+) and negative controls (-) are shown (right panel). (B) Summary of the data generated for selection of a highly specific primer pair. Ct: cycle threshold. Amplification efficiency and R2 relates to the log-linear fit of the relation between Relative quantity vs. Ct for known serial dilutions of a positive control. An amplification efficiency of 100% represents a decrease of one Ct for a 1:2 dilution. Unspecific amplification: Ct of amplification curves observed in negative controls (without template), probably due to primer dimers. (C) UCSC Genome Browser image, depicting the position of the mutations within each SARS-CoV-2 variant of concern, and the position of the selected primer pair (RdRP) for the following experiments
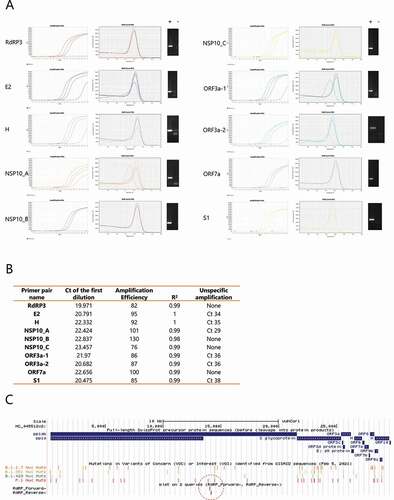
Figure 2. Using an intercalating dye can yield similar sensitivity and specificity as TaqMan probes. (A) Paired boxplot of the Ct shift for the SYBR Green RT-qPCR (RdRP amplicon) versus two different TaqMan-based reactions (N and ORF1ab amplicons) using the Charité protocol. (B) RT-qPCR amplification curves for serial dilutions of a SARS-CoV-2 standard RNA, from 4 × 10⁵ copies per µL (c/µL) to 4 c/µL, using either the unmodified Charité protocol (TaqMan) or the one adapted for an intercalating dye (SYBR Green). (C) Summary of the performance obtained using the different commercial and customized RT-qPCR protocols evaluated. (D) Ct values for each sample tested with every RT-qPCR protocol developed and optimized in this work. Not all samples were evaluated with all protocols. The cut-off for positivity for each mix is shown with an orange line. Diagnostic was done with a TaqMan commercial kit. Negative samples with undetermined Ct were assigned a pseudo-Ct of 41. (E) A drop in diagnostic sensitivity using two-step RT-qPCR approaches is circumscribed to samples with higher Ct values. Table summarizing the sensitivity observed using either the INBIO master mix or the custom-made mix when separating the positive samples in terciles (T1-T3) according to the previously assessed Ct value using the RT-qPCR DisCoVery kit (ORF1ab and N amplicons). (F) RT-qPCR amplification curves for either serial dilutions of a pool of positive samples (top panel) or random samples (bottom panel), using four different retro-transcriptases for cDNA synthesis
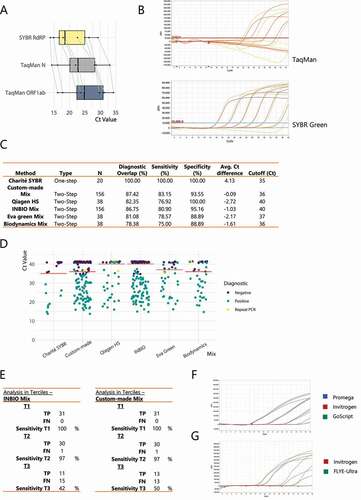
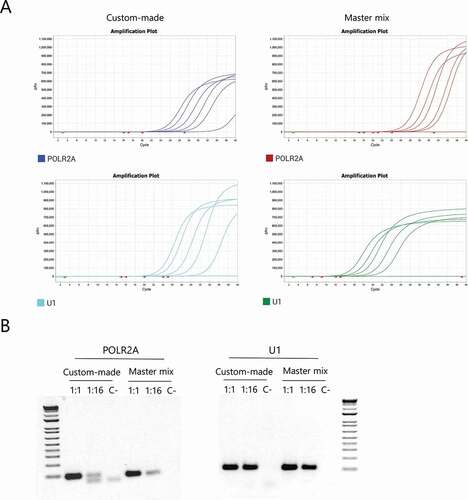
Figure 3. Selection of a human housekeeping gene to be used as internal control. (A) Representative amplification curves for POLR2A and U1 using both the custom-made mix and the INBIO master mix. (B) Agarose gel electrophoresis of the products obtained after qPCR of 1:1, 1:16 dilutions and the negative control respectively, for each primer pair using both mixes