
Figures & data
Figure 1. Defective polyadenylation reshapes the rhythm of clock genes. Relative expression level (R.E.L) of gene and transcript expression levels of clock genes (BOA and LUX) in mutants AtCPSF30 (oxt6) (a-e) and AtCPSF100 (esp5) (f-j). The grey box indicates the subjective night. Error bars represent the standard deviation from three biological replicates and asterisks are indicative of statistically significant differences using one-way ANOVA. ZT indicates Zeitgeber time. In (a–j), data are presented as mean ± SD. *p-value < 0.05. **p-value < 0.01
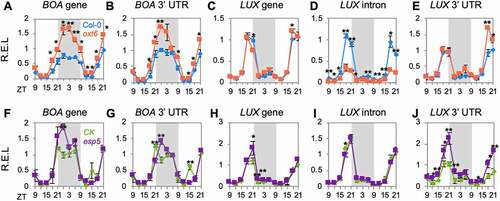
Figure 2. Diurnal rhythm of polyadenylation profile in Arabidopsis. (a) Multi-dimension scales of rhythmic and arrhythmic poly(A) transcripts. Grey shadow indicates night time; (b) Heat maps illustrate the time-course expression profiles of rhythmic and arrhythmic poly(A) transcripts; (c) Venn diagram of genes producing rhythmic poly(A) transcripts (RTG), genes producing arrhythmic poly(A) transcripts (ATG), and APA genes. The rhythm of genes involved in important biological processes is shown by Z-scores of expression level (dots). Expression trends along with time-course are performed by the ‘loess’ method. Standard deviations are shown by subjective coloured shadows. Gene models and identified polyadenylation sites are marked with coloured lines on genes
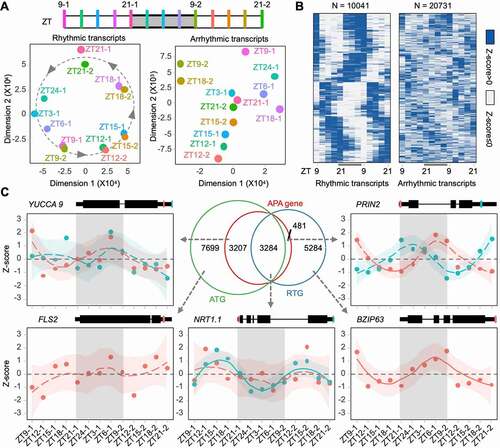
Figure 3. Features of the rhythmic and arrhythmic transcripts. (a) Differential expression (DE) transcript counts along with time course. Adjacent time points are compared; (b) Heatmap of significant rhythmically expressed transcripts derived from core poly(A) factors; (c) Comparison of enriched non-redundant gene ontology terms among diverse types of genes. ‘asynchronous’ indicates genes producing both rhythmic and arrhythmic transcripts; (d) Read counts of different transcript types; (e) Percentage of transcripts found on polysome; (f) Sankey plot illustrates the source of poly(A) sites in APA genes. Each line represents a gene
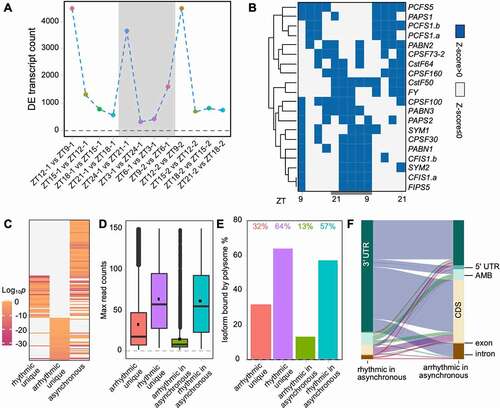
Figure 4. Rhythmic and arrhythmic transcripts have different nucleotide contents
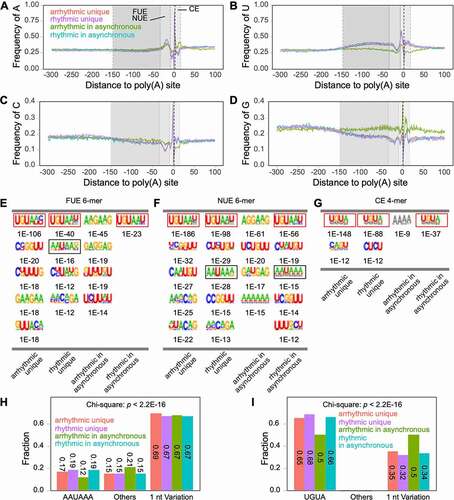
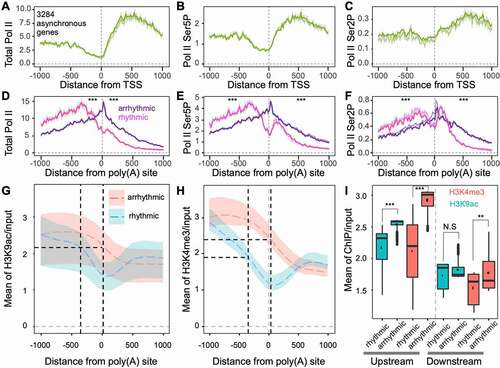
Figure 5. Transcription activation histone markers are associated with rhythmic and arrhythmic transcript differentiation from the same genes. (a-c) Nascent RNA profiles around transcription start sites (TSS) of genes producing both rhythmic and arrhythmic transcripts. The y-axis indicates the mean depth of subjective Pol II occupancy; (d-f) Nascent RNA profiles around poly(A) sites of rhythmic and arrhythmic transcripts. The Wilcoxon signed-rank test was used to test differences across separate groups, either upstream or downstream of poly(A) sites. *** indicates p < 0.001; (g) H3K9ac profiles around poly(A) sites of rhythmic and arrhythmic transcripts. Black dashed vertical lines indicate the peaks of total Pol II corresponding to panel D. Coloured shadows indicate H3K9ac variation ranges corresponding to the circadian clock. The coloured dashed line indicates the mean of H3K9ac corresponding to the circadian clock; (h) H3K4me3 profiles around poly(A) sites of rhythmic and arrhythmic transcripts; (i) H3K9ac and H3K4me3 levels at upstream (−1000 to 0 bp) and downstream (0 to 1000 bp) of poly(A) sites of rhythmic and arrhythmic transcripts. ** indicates p < 0.01, N.S. indicates non-significance (p > 0.05)
Availability statement
The PAT‐seq data have been deposited in the BioProject database at NCBI (http://www.ncbi.nlm.nih.gov/bioproject/) under accession number PRJNA559744.