Figures & data
Table 1. Primers for seamless BbsI cloning (recognition site in bold) of the c-myc chimera 1A and the and β2-µglob chimera and subsequent synthesis of PCR products with T7 promoter
Table 2. Primers for making PCR products to produce RNA probes
Figure 1. Annexin A2 binds to the c-myc IRES. Panel A: Schematic representation of the predicted secondary structure of mouse c-myc 5ʹUTR using Sfold and the different regions (transcripts) of c-myc 5ʹUTR used in the binding experiments. Panel B: Schematic representation of the locations of regions 4A, 4Ai and 4B of mouse c-myc IRES in the experimentally deduced human c-myc IRES (adopted from [Citation53]). Panel C: The binding of different radiolabelled [α32P]-rUTP c-myc 5ʹUTR transcripts to 3 μM AnxA2 in the presence of 70 µM Ca2+. 15 fmoles of regions 1–4Ai and the stem region of region 2, consisting of NegA (NA) and NegB (NB), as indicated in Panel A, were UV-crosslinked with AnxA2. AnxA2 stained with Coomassie Brilliant Blue served as a loading control. Panel D: UV-crosslinking of 3 μM of recombinant AnxA2 bound to 20 fmoles of uniformly radiolabelled full-length c-myc 5´UTR transcript alone (lanes 2 and 5), and to increasing amounts (10- or 50-fold molar excess) of the unlabelled c-myc full-length 5´UTR (lanes 3 and 4, respectively), and region 4A of the 5´UTR (lanes 6 and 7, respectively). Lane 1 contained only the radiolabelled full-length c-myc 5´UTR transcript to assess the effect of the RNAses added after UV-exposure. AnxA2 stained with Coomassie Brilliant Blue served as a loading control. Note that the protein bands in the upper gel were slightly blurred during drying before exposure to screens and phosphor imaging. Panels C and D: The transcripts were covalently bound to AnxA2 in the presence of 1 μg/μL yeast tRNA to inhibit non-specific RNA binding and then subjected to 10% SDS-PAGE. The binding was visualized using screens and phosphor imaging after ON exposure. AnxA2 is indicated to the right. Panel E: Histogram of the results of the binding competition; UV-crosslinking of 3 μM of recombinant AnxA2 bound to 20 fmoles of uniformly radiolabelled full-length c-myc 5´UTR transcript alone (columns 1 and 4), and to increasing amounts (10- or 50-fold molar excess) of the unlabelled c-myc full-length 5´UTR (columns 2 and 3, respectively), or region 4A of the 5´UTR (columns 5 and 6, respectively). The mean of two experiments is shown
![Figure 1. Annexin A2 binds to the c-myc IRES. Panel A: Schematic representation of the predicted secondary structure of mouse c-myc 5ʹUTR using Sfold and the different regions (transcripts) of c-myc 5ʹUTR used in the binding experiments. Panel B: Schematic representation of the locations of regions 4A, 4Ai and 4B of mouse c-myc IRES in the experimentally deduced human c-myc IRES (adopted from [Citation53]). Panel C: The binding of different radiolabelled [α32P]-rUTP c-myc 5ʹUTR transcripts to 3 μM AnxA2 in the presence of 70 µM Ca2+. 15 fmoles of regions 1–4Ai and the stem region of region 2, consisting of NegA (NA) and NegB (NB), as indicated in Panel A, were UV-crosslinked with AnxA2. AnxA2 stained with Coomassie Brilliant Blue served as a loading control. Panel D: UV-crosslinking of 3 μM of recombinant AnxA2 bound to 20 fmoles of uniformly radiolabelled full-length c-myc 5´UTR transcript alone (lanes 2 and 5), and to increasing amounts (10- or 50-fold molar excess) of the unlabelled c-myc full-length 5´UTR (lanes 3 and 4, respectively), and region 4A of the 5´UTR (lanes 6 and 7, respectively). Lane 1 contained only the radiolabelled full-length c-myc 5´UTR transcript to assess the effect of the RNAses added after UV-exposure. AnxA2 stained with Coomassie Brilliant Blue served as a loading control. Note that the protein bands in the upper gel were slightly blurred during drying before exposure to screens and phosphor imaging. Panels C and D: The transcripts were covalently bound to AnxA2 in the presence of 1 μg/μL yeast tRNA to inhibit non-specific RNA binding and then subjected to 10% SDS-PAGE. The binding was visualized using screens and phosphor imaging after ON exposure. AnxA2 is indicated to the right. Panel E: Histogram of the results of the binding competition; UV-crosslinking of 3 μM of recombinant AnxA2 bound to 20 fmoles of uniformly radiolabelled full-length c-myc 5´UTR transcript alone (columns 1 and 4), and to increasing amounts (10- or 50-fold molar excess) of the unlabelled c-myc full-length 5´UTR (columns 2 and 3, respectively), or region 4A of the 5´UTR (columns 5 and 6, respectively). The mean of two experiments is shown](/cms/asset/3753ecc3-79e4-41c1-9550-8e54e9f47dc7/krnb_a_1947648_f0001_c.jpg)
Figure 2. AnxA2 derived from PC12 cells and wild type recombinant AnxA2 binds the IRES of c-myc 5´UTR in the presence of calcium. Panel A: Schematic presentation of the AnxA2 ‘capture’ procedure by the c-myc 5´UTR with or without the IRES as baits. An antisense biotin-5´DNA oligomer to the 3´end of c-myc 5´UTR was bound to magnetic streptavidin beads. Subsequently, the c-myc 5´UTR with or without the IRES was bound to the immobilized antisense DNA oligomer. The now immobilized c-myc 5´UTRs were incubated with the cytoskeletal fraction of PC12 cells. After several washes, proteins were released by RNase A/T1 treatment before SDS-PAGE and Western blot analyses using AnxA2 monoclonal antibodies. Panel B: AnxA2 in the cytoskeletal fraction of PC12 cells binds to the c-myc 5´UTR containing the IRES only in the presence of 70 µM Ca2+, but not to the c-myc 5´UTR lacking the IRES. The procedure was performed in the absence (lanes 1 and 4) or presence of 70 µM added Ca2+ (lanes 2 and 5) or in the presence of 2 mM EGTA (lanes 3 and 6). Panel C: The corresponding fractions containing unbound AnxA2 (not bound to the immobilized c-myc 5´UTRs) to the fractions shown in Panel B. Panel D: Control experiments showing that AnxA2 fails to bind to the DNA linker with biotin or to streptavidin and that RNase treatment is required to release the captured AnxA2 (compare with Panel B). The first lane to the left contains 40 µg of proteins from the cytoskeletal fraction of PC12 cells. Panel E: Ca2+-dependency of the binding of full-length AnxA2, but not of its N-terminally truncated or His-tagged versions, to the c-myc IRES. 15 fmoles of region 2 of c-myc 5ʹUTR (as indicated in , Panel A) were UV-crosslinked with full-length AnxA2 (lane 1), ∆19AnxA2 (lane 2), ∆33AnxA2 (lane 3) or His-tagged AnxA2 (lane 4) in the absence or presence of 70 µM Ca2+ as indicated and subjected to 10% SDS-PAGE. The RNA transcripts containing [α32P]-rUTP were covalently bound to AnxA2 in the presence of 1 μg/μL yeast tRNA to inhibit non-specific RNA binding, subjected to 10% SDS-PAGE, whereafter the binding was visualized using screens and phosphor-imaging after a 13 h exposure (or 22 h exposure for the two lanes numbered 4). AnxA2 stained with Coomassie Brilliant Blue served as a loading control. AnxA2 is indicated to the right
![Figure 2. AnxA2 derived from PC12 cells and wild type recombinant AnxA2 binds the IRES of c-myc 5´UTR in the presence of calcium. Panel A: Schematic presentation of the AnxA2 ‘capture’ procedure by the c-myc 5´UTR with or without the IRES as baits. An antisense biotin-5´DNA oligomer to the 3´end of c-myc 5´UTR was bound to magnetic streptavidin beads. Subsequently, the c-myc 5´UTR with or without the IRES was bound to the immobilized antisense DNA oligomer. The now immobilized c-myc 5´UTRs were incubated with the cytoskeletal fraction of PC12 cells. After several washes, proteins were released by RNase A/T1 treatment before SDS-PAGE and Western blot analyses using AnxA2 monoclonal antibodies. Panel B: AnxA2 in the cytoskeletal fraction of PC12 cells binds to the c-myc 5´UTR containing the IRES only in the presence of 70 µM Ca2+, but not to the c-myc 5´UTR lacking the IRES. The procedure was performed in the absence (lanes 1 and 4) or presence of 70 µM added Ca2+ (lanes 2 and 5) or in the presence of 2 mM EGTA (lanes 3 and 6). Panel C: The corresponding fractions containing unbound AnxA2 (not bound to the immobilized c-myc 5´UTRs) to the fractions shown in Panel B. Panel D: Control experiments showing that AnxA2 fails to bind to the DNA linker with biotin or to streptavidin and that RNase treatment is required to release the captured AnxA2 (compare with Panel B). The first lane to the left contains 40 µg of proteins from the cytoskeletal fraction of PC12 cells. Panel E: Ca2+-dependency of the binding of full-length AnxA2, but not of its N-terminally truncated or His-tagged versions, to the c-myc IRES. 15 fmoles of region 2 of c-myc 5ʹUTR (as indicated in Fig. 1, Panel A) were UV-crosslinked with full-length AnxA2 (lane 1), ∆19AnxA2 (lane 2), ∆33AnxA2 (lane 3) or His-tagged AnxA2 (lane 4) in the absence or presence of 70 µM Ca2+ as indicated and subjected to 10% SDS-PAGE. The RNA transcripts containing [α32P]-rUTP were covalently bound to AnxA2 in the presence of 1 μg/μL yeast tRNA to inhibit non-specific RNA binding, subjected to 10% SDS-PAGE, whereafter the binding was visualized using screens and phosphor-imaging after a 13 h exposure (or 22 h exposure for the two lanes numbered 4). AnxA2 stained with Coomassie Brilliant Blue served as a loading control. AnxA2 is indicated to the right](/cms/asset/d608b7a4-1770-4f75-a772-59ae5c8cca67/krnb_a_1947648_f0002_c.jpg)
Figure 3. High translational efficiency of the chimeric c-myc reporter mRNA in an in vitro coupled transcription/translation system depends on the joint presence of the c-myc 5ʹUTR and 3ʹUTR. Panel A: Schematic representation of the different chimeric mRNAs used in Panel B: The T7-driven expression of chimeric mRNAs from PCR products (8 ng/μL) containing regions coding for the CDS of RLuc alone, c-myc-5ʹUTR-RLuc-c-myc-3ʹUTR (chimera 1A), c-myc-5ʹUTR-RLuc (chimera 2), RLuc-c-myc-3ʹUTR (chimera 3), β2-µglob-5ʹUTR-RLuc-β2-µglob-3ʹUTR (chimera 4) or β2-µglob-5ʹUTR-RLuc-c-myc-3ʹUTR (chimera 5) mRNAs. The transcription reaction and subsequent translation of the RLuc reporter were performed at 30°C. The incorporation of [35S]-Met is expressed as the % relative to c-myc-5ʹUTR-RLuc-c-myc-3ʹUTR (chimera 1A; 100%). It was measured as counts per minute (cpm)/mole cDNA and determined using the mean value of the triplicates withdrawn at 60 min to indicate the efficiency of each chimeric mRNA in the in vitro system. * Indicates p < 0.05 based on two-tailed Student’s t-test compared to control (RLuc alone)
![Figure 3. High translational efficiency of the chimeric c-myc reporter mRNA in an in vitro coupled transcription/translation system depends on the joint presence of the c-myc 5ʹUTR and 3ʹUTR. Panel A: Schematic representation of the different chimeric mRNAs used in Panel B: The T7-driven expression of chimeric mRNAs from PCR products (8 ng/μL) containing regions coding for the CDS of RLuc alone, c-myc-5ʹUTR-RLuc-c-myc-3ʹUTR (chimera 1A), c-myc-5ʹUTR-RLuc (chimera 2), RLuc-c-myc-3ʹUTR (chimera 3), β2-µglob-5ʹUTR-RLuc-β2-µglob-3ʹUTR (chimera 4) or β2-µglob-5ʹUTR-RLuc-c-myc-3ʹUTR (chimera 5) mRNAs. The transcription reaction and subsequent translation of the RLuc reporter were performed at 30°C. The incorporation of [35S]-Met is expressed as the % relative to c-myc-5ʹUTR-RLuc-c-myc-3ʹUTR (chimera 1A; 100%). It was measured as counts per minute (cpm)/mole cDNA and determined using the mean value of the triplicates withdrawn at 60 min to indicate the efficiency of each chimeric mRNA in the in vitro system. * Indicates p < 0.05 based on two-tailed Student’s t-test compared to control (RLuc alone)](/cms/asset/af2d296c-2732-4c60-acb7-445ecd016d0b/krnb_a_1947648_f0003_b.gif)
Figure 4. The effect of AnxA2 on the expression of the RLuc reporter in an in vitro coupled transcription/translation system. The T7-driven transcription of chimeric mRNAs from PCR fragments (22 ng/μL) containing the following coding regions: Panels E and I: chimera 1A [c-myc-5ʹUTR-RLuc-c-myc-3ʹUTR, as presented in Panel A]; Panels F and J: chimera 1B [presented in Panel B], Panels G and K: chimera 1 C [presented in Panel C] and Panels H and L [presented in Panel D]. Panels E, F, G and H: Translation for 60 min. The results are presented as percentage incorporated [35S]-Met, as determined by scintillation counting, relative to the reactions in the absence of His-AnxA2. Panels I, J, K and L: The equivalent time-course of the expression of the RLuc reporter in the in vitro coupled transcription/translation system to Panels E-H. Panel M: comparison of the relative translational efficiency of chimeras 1A, 1B, 1C and 1D [chimera 1A was set to 100%]. Panel N: Controls addressing the effects of 10 (blue columns) or 20 (orange columns) μM of exogenously added mutant AnxA2 that does not bind RNA [Citation10,Citation58] (dark blue and dark orange columns, respectively), or BSA (light blue and light orange columns, respectively), on the expression of chimera 1A were studied. The translation of the constructs was performed for 60 min at 30°C in the absence (green) or presence of 10 (blue) or 20 µM (orange) of His-AnxA2 as indicated. Aliquots in duplicates (0, 15, and 30 min) or triplicates (60 min) were withdrawn and the incorporation of [35S]-Met, expressed as cpm/22 ng cDNA, is given as the mean value determined for the duplicates or triplicates. The standard deviations are also indicated. The results from three independent experiments (n = 3) are shown in % relative to control with no additions (100%) and the columns also indicate the standard deviations. Statistical significance was determined by the two-tailed Student’s t-test (*p < 0.05; n = 3). Panel O: The binding of radiolabelled [α32P]-rUTP transcripts to AnxA2. 15 fmoles of full-length 5ʹUTR (lane 1), 3ʹUTR (lane 2) of c-myc mRNA or CDS of hRLuc mRNA (lane 3) were UV-crosslinked with 3 μM of purified wt AnxA2 and subjected to 10% SDS-PAGE. The RNA containing [α32P]-rUTP and covalently bound to AnxA2 was visualized using screens and phosphor-imaging following an ON exposure
![Figure 4. The effect of AnxA2 on the expression of the RLuc reporter in an in vitro coupled transcription/translation system. The T7-driven transcription of chimeric mRNAs from PCR fragments (22 ng/μL) containing the following coding regions: Panels E and I: chimera 1A [c-myc-5ʹUTR-RLuc-c-myc-3ʹUTR, as presented in Panel A]; Panels F and J: chimera 1B [presented in Panel B], Panels G and K: chimera 1 C [presented in Panel C] and Panels H and L [presented in Panel D]. Panels E, F, G and H: Translation for 60 min. The results are presented as percentage incorporated [35S]-Met, as determined by scintillation counting, relative to the reactions in the absence of His-AnxA2. Panels I, J, K and L: The equivalent time-course of the expression of the RLuc reporter in the in vitro coupled transcription/translation system to Panels E-H. Panel M: comparison of the relative translational efficiency of chimeras 1A, 1B, 1C and 1D [chimera 1A was set to 100%]. Panel N: Controls addressing the effects of 10 (blue columns) or 20 (orange columns) μM of exogenously added mutant AnxA2 that does not bind RNA [Citation10,Citation58] (dark blue and dark orange columns, respectively), or BSA (light blue and light orange columns, respectively), on the expression of chimera 1A were studied. The translation of the constructs was performed for 60 min at 30°C in the absence (green) or presence of 10 (blue) or 20 µM (orange) of His-AnxA2 as indicated. Aliquots in duplicates (0, 15, and 30 min) or triplicates (60 min) were withdrawn and the incorporation of [35S]-Met, expressed as cpm/22 ng cDNA, is given as the mean value determined for the duplicates or triplicates. The standard deviations are also indicated. The results from three independent experiments (n = 3) are shown in % relative to control with no additions (100%) and the columns also indicate the standard deviations. Statistical significance was determined by the two-tailed Student’s t-test (*p < 0.05; n = 3). Panel O: The binding of radiolabelled [α32P]-rUTP transcripts to AnxA2. 15 fmoles of full-length 5ʹUTR (lane 1), 3ʹUTR (lane 2) of c-myc mRNA or CDS of hRLuc mRNA (lane 3) were UV-crosslinked with 3 μM of purified wt AnxA2 and subjected to 10% SDS-PAGE. The RNA containing [α32P]-rUTP and covalently bound to AnxA2 was visualized using screens and phosphor-imaging following an ON exposure](/cms/asset/1afa49c4-0213-4306-905d-959c5d5b8e91/krnb_a_1947648_f0004_c.jpg)
Figure 5. Low concentrations of AnxA2 (0.1–1 µM) has a stimulatory effect on the expression of the c-myc RLuc reporter in an in vitro coupled transcription/translation system. The T7-driven transcription of chimera 1A [c-myc-5ʹUTR-RLuc-c-myc-3ʹUTR] from a PCR fragment (22 ng/μl). Subsequent translation of the construct was performed for 60 min at 30°C in the absence or presence of 0.1, 1, 10 or 20 µM of His-AnxA2 as indicated. Aliquots in triplicates (60 min) were withdrawn. The results are presented as percentage incorporated [35S]-Met, as determined by scintillation counting, relative to the reactions in the absence (set at 100%) of His-AnxA2. The results from three independent experiments (n = 3) are shown. The standard deviations are also indicated. Statistical significance was determined by the two-tailed Student’s t-test (*p < 0.05)
![Figure 5. Low concentrations of AnxA2 (0.1–1 µM) has a stimulatory effect on the expression of the c-myc RLuc reporter in an in vitro coupled transcription/translation system. The T7-driven transcription of chimera 1A [c-myc-5ʹUTR-RLuc-c-myc-3ʹUTR] from a PCR fragment (22 ng/μl). Subsequent translation of the construct was performed for 60 min at 30°C in the absence or presence of 0.1, 1, 10 or 20 µM of His-AnxA2 as indicated. Aliquots in triplicates (60 min) were withdrawn. The results are presented as percentage incorporated [35S]-Met, as determined by scintillation counting, relative to the reactions in the absence (set at 100%) of His-AnxA2. The results from three independent experiments (n = 3) are shown. The standard deviations are also indicated. Statistical significance was determined by the two-tailed Student’s t-test (*p < 0.05)](/cms/asset/6735f7c5-c352-4cba-afe3-4051e07481cc/krnb_a_1947648_f0005_b.gif)
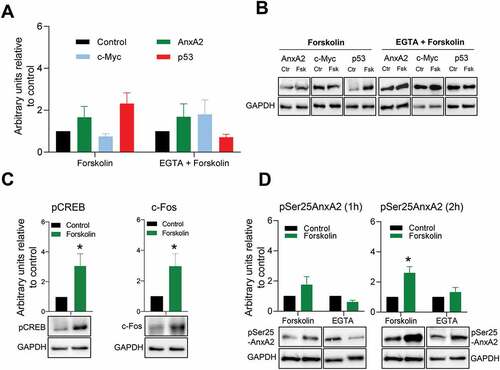
Figure 6. Short-term (1 hr) forskolin treatment increases the expression of p53 while decreasing the expression of c-Myc. Panel A: 1 hr stimulation of PC12 cells with 20 µM Fsk alone or in combination with a 1 hr pre-treatment with 100 µM EGTA and the effect on the expression of AnxA2, c-Myc and p53. The controls are indicated with black columns and are untreated cells with vehicle (DMSO) for Fsk treatment alone. For Fsk treatment with pre-incubation with EGTA, the control cells were treated with vehicle and EGTA. Panel B: Representative Western blots of the results shown in Panel A. GAPDH was used as a loading control. Panel C: The effect of 1 hr Fsk treatment on the phosphorylation of CREB and the expression of c-Fos. Untreated controls are shown as black columns and Fsk-treated cells with green columns. Representative Western blots are shown below the columns. Panel D: The effect of 1 and 2 hr Fsk treatment on the Ser25 phosphorylation of AnxA2. Proteins (12 μg) derived from total lysate from PC12 cells were subjected to 4–20% SDS-PAGE and western blot analysis. The results from three independent experiments (n = 3) are shown and were normalized to GAPDH. The standard deviations are also indicated. Statistical significance compared to control was determined by the two-tailed Student’s t-test (*p < 0.05)