Figures & data
Figure 1. Identifying a fragment of Kras mRNA to probe for Igf2bp1 binding. (a) Different fragments spanning the Kras mRNA coding region, and part of its 3ʹUTR, were 5ʹ end labelled with fluorescein and used as substrates for Igf2bp1 binding in an FP assay. Two fragments from cofilin mRNA, cfl7 and cfl4, that were previously shown to bind or not bind, respectively, Igf2bp1 [Citation36], were included as controls. (Y axis, FP ratio; no shift-i.e. no binding – FP ratio = 1.) (b) Schematic map of the different fragments of Kras used in the FP assay in (a). (c) Increasing concentrations of Igf2bp1 protein (indicated at the top of the lanes), incubated with 100 nM fluorescently labelled Kras 6 RNA, retarded migration of the RNA in a non-denaturing polyacrylamide gel (EMSA). (d) The kinetics of Kras 6 RNA binding to Igf2bp1 were monitored by MST; insert, a representative MST thermophoresis curve.
![Figure 1. Identifying a fragment of Kras mRNA to probe for Igf2bp1 binding. (a) Different fragments spanning the Kras mRNA coding region, and part of its 3ʹUTR, were 5ʹ end labelled with fluorescein and used as substrates for Igf2bp1 binding in an FP assay. Two fragments from cofilin mRNA, cfl7 and cfl4, that were previously shown to bind or not bind, respectively, Igf2bp1 [Citation36], were included as controls. (Y axis, FP ratio; no shift-i.e. no binding – FP ratio = 1.) (b) Schematic map of the different fragments of Kras used in the FP assay in (a). (c) Increasing concentrations of Igf2bp1 protein (indicated at the top of the lanes), incubated with 100 nM fluorescently labelled Kras 6 RNA, retarded migration of the RNA in a non-denaturing polyacrylamide gel (EMSA). (d) The kinetics of Kras 6 RNA binding to Igf2bp1 were monitored by MST; insert, a representative MST thermophoresis curve.](/cms/asset/8d4b4810-1c60-4500-ac59-107e66f3e04b/krnb_a_2010983_f0001_oc.jpg)
Figure 2. High throughput screen for Igf2bp1 inhibitors. (a) A snake plot of the FP screen for inhibitors of Igf2bp1 binding to fluorescent Kras 6 RNA. Over 27,000 compounds were screened (X-axis), and the robust Z score for each assay was plotted along the Y-axis. The shaded points on the curve represent compounds that showed a fluorescence polarization shift of greater than 3 standard deviations; the red point indicates the position of compound 7773. (b) The structure of compounds 7773 and 393. (c) 7773 or 393 was added at increasing concentrations (X-axis), and the percent activity of protein-RNA binding was plotted on the Y-axis. For Igf2bp1 binding to Kras 6 RNA, the IC50 for 7773 was 30.45 μM (N = 4), and for 393, the IC50 was 91.1 μM (N = 1). As a control, the ability of 7773 to inhibit binding of a different RNA binding protein, La, to Bcl2 RNA was assayed, and its IC50 was greater than 100 μM (N = 3). (d) MST was used to determine the KD of Igf2bp1 binding to either 7773 (green) or 393 (red). (e) No binding of 7773 to La was observed in an MST assay. Representative MST thermophoresis curves are inserted in (D) and (E).
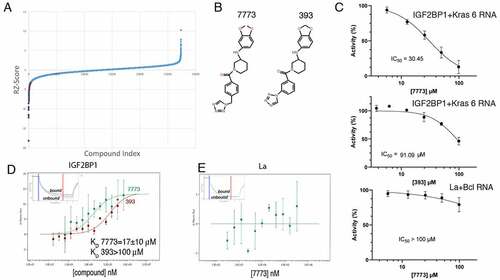
Figure 3. 7773 binds to RNA binding domains of Igf2bp1. (a) Domain structure organization of Igf2bp1. Six RNA binding domains are organized in three di-domains: RRM12, KH12 and KH34. The arrowheads indicate the boundaries of the individual RNA binding domains; the di-domain constructs used in this study are indicated by arrows below the map. (b) MST binding curves of 7773 to the di-domains RRM12 (blue), KH12 (green), and KH34 (red). Representative MST thermophoresis curves are inserted. (c) Overlay of 15N-HSQC spectra recorded on the free RRM12, KH12 and KH34 di-domains (navy) and at a 1:14 protein-to-7773 molar ratio (Orange). The dispersed region between 1H 8.3–9.6 and 15N 111.6–127.2 ppm is displayed, as representative of the full spectra of the titration reported in Supplemental Fig. 3. Grey arrowheads indicate peaks that shifted significantly upon addition of 7773.
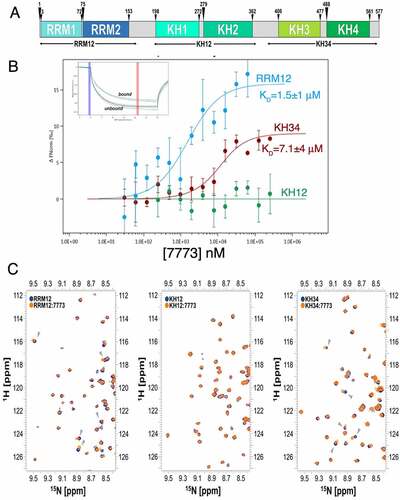
Figure 4. 7773 binding surface. (a) KH34 per-residue chemical shift perturbations (CSP) recorded upon 1:147,773 binding. The green boxes indicate the KH3 and KH4 domains boundaries. The dotted lines indicate, respectively, one (yellow), two (Orange) and three (red) standard deviations of the average CSP observed. (b) Cartoon representation of KH34 di-domain. RNA is coloured in pale cyan. (c) Binding surface of 7773 on KH34. The affected residues, in the space filling model, are depicted in salmon, with the left panel oriented as in (B), and the right panel with a 180° rotation. (d) DALI Structural alignment of Igf2bp1 KH12 (grey) and KH34 (pale green) di-domains. The structural elements that are not conserved between the two di-domains are highlighted in magenta. (e) Primary sequence CLUSTAL X alignment of KH12 and KH34. The secondary structure elements are reported above and below KH12 and KH34 sequences, respectively. The residues of the binding surface are indicated by Orange arrowheads. (f) KH34 hydrophobicity. The hydrophobic, polar neutral and charged residues are depicted, respectively, in yellow, green and blue, while the RNA in pale cyan. The panel is oriented as in (B). (g) Overlay of the 15N-HSQC spectra of KH34 in the apo and complex with 7773 in low and high salt conditions (navy, Orange, and maroon, respectively). The panel reports a zoom in the representative region between 1H 8.66–9.10 and 15N 111.50–116.00 ppm, as representative of the full spectra of the titration reported in Supplemental Fig. 4. (h) KH34 per-residue chemical shift perturbations (CSP) recorded upon 1:147,773 binding in low (Orange) and high (maroon) salt.
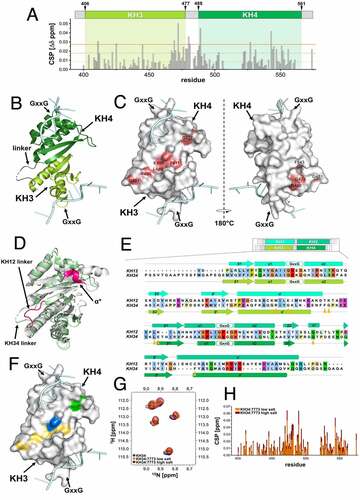
Figure 5. Inhibition of Igf2bp1 RNA binding in vitro. (a) EMSA with fluorescent Kras 6 RNA comparing the effect of incubation of increasing concentrations of Igf2bp1 with either DMSO or 200 μM 7773 on retardation of RNA migration. (b) EMSA with fluorescent Bcl2 RNA comparing the effect of incubation of increasing concentrations of La protein with either DMSO or 200 μM 7773 on retardation of RNA migration. (c) MST analysis of the effect of 7773 on the binding of Igf2bp1 to Kras 6 RNA. In the absence of compound, the KD = 56 nM; in the presence of 50 μM 7773, the KD = 63 nM, and in the presence of 100 μM 7773, the KD = 120 nM. Representative MST thermophoresis curves are inserted.
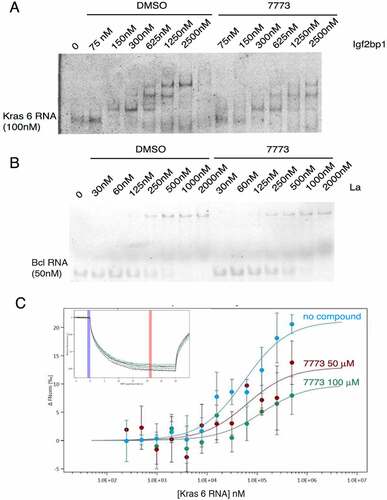
Figure 6. Binding of 7773 to other Igf2bp paralogues. MST analysis of 7773 incubation with (a) Igf2bp2 and (b) Igf2bp3. Representative MST thermophoresis curves are inserted. (c) EMSA with fluorescent Kras 6 RNA comparing the effect of incubation of increasing concentrations of Igf2bp3 with either DMSO or 200 μM 7773 on retardation of RNA migration. *, indicates that some of the sample leaked out of the lane.
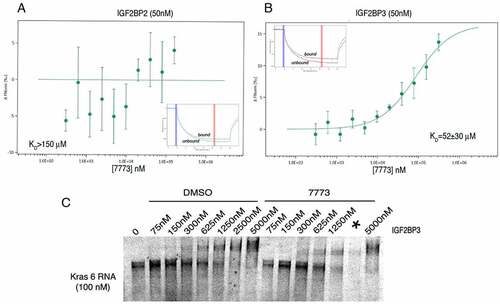
Figure 7. 7773 targets human Igf2bp1 in transfected mouse LKR-M cells. LKR-M cells were transfected with either full length human Igf2bp1-GFP (Fl, circles(or GFP alone (GFP, triangles) and then assayed by Incucyte Live Cell Analysis System for their ability to migrate in a wound healing assay in the presence of either 20 μM 7773 (red) or DMSO (black).

Figure 8. Use of a split-luciferase assay to observe 7773 targeting of Igf2bp1 in transfected RKO cells. (a) Schematic presentation of assay principal: luciferase activity is detected only when Igf2bp1 dimerizes on target RNA. (b) Four split luciferase reporter plasmids fused with Igf2bp1 in different orientations vis-à-vis the luciferase fragments (left) were assessed for efficiency of luciferase activity in RKO cells (right). (c) Ectopic expression of wild-type Igf2bp1 inhibits split-luciferase activity. Treatment with 50 μM 7773 inhibited (d) split-luciferase activity, but not (e) control luciferase in RKO cells.
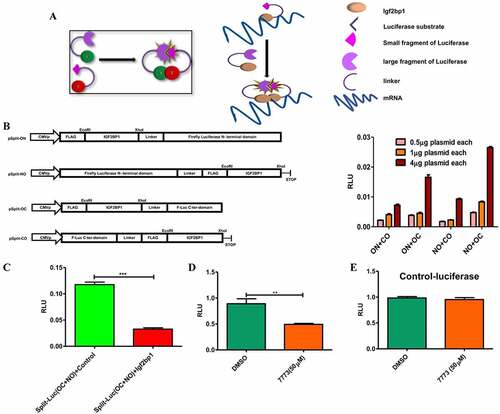
Figure 9. 7773 downregulates Kras and other Igf2bp1 target RNAs, Kras protein, and downstream signalling. (a) Real-time PCR analysis of steady state levels of CD44, Kras, cMyc, and SRF RNA in ES2 or H1299 cells treated with either 20 μM 7773 (red) or DMSO (green) for 12 or 24 hours. (b) Western blot analysis of Kras expression in H1299 cells incubated in 20 μM 7773, 10 μM 7773, or DMSO for 48 hours. Duplicates were performed and analysed for each concentration. Tubulin was used as loading control. (c) Quantification of the blot in (B), normalized to tubulin and to the relative level of Kras protein in the DMSO-treated samples. (d) H1299 cells were cultured with either 20 μM 7773 or DMSO for 24 hours, after which FCS was removed from the medium and the cells were cultured for another 24 hours. At that point, FCS was re-added for either 10ʹ or 30ʹ and then protein extracts were prepared and analysed by Western blot for expression of ERK (green) and phosphoERK (pERK, red). Cells grown continuously in FCS for 48.5 hours were used as controls. Experimental duplicates were run on the gel. (e) Quantification of the western shown in (D), with the ratio of pERK to ERK plotted on the Y-axis.
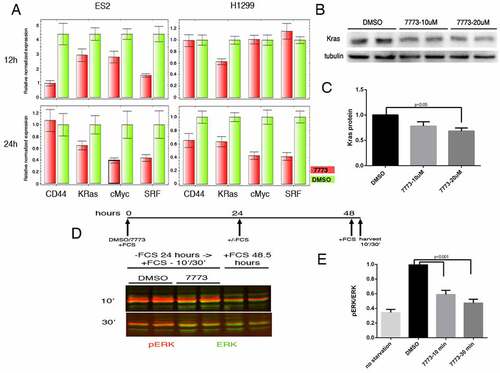
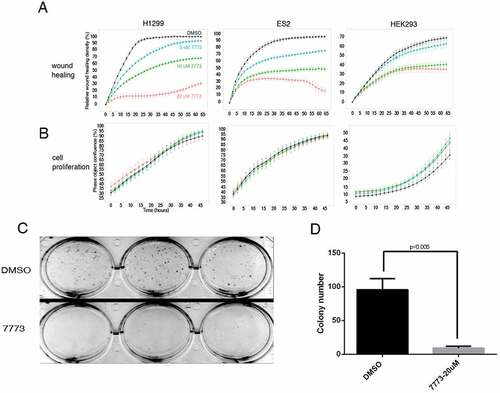
Figure 10. 7773 inhibits wound healing and growth in soft agar without affecting cell proliferation. H1299, ES2, and HEK293 cells were incubated with DMSO (black) or different concentrations of 7773 (5 μM, blue; 10 μM, green; 20 μM, red) and analysed for (a) wound healing or (b) cell proliferation using the Incucyte Live Cell Analysis System. (c) H1299 cells were seeded in triplicate in soft agar in the presence of either DMSO or 7773 (20 μM) and cultured for 2 weeks. (d) Quantification of the results in (C).