Figures & data
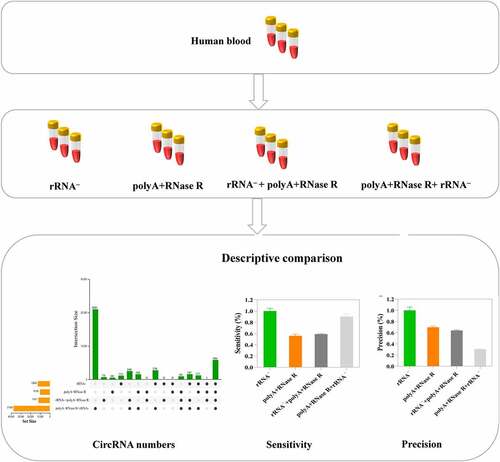
Table 1. The list of primers used in this research
Figure 1. The workflow of total RNA isolation, circRNA library preparation and sequencing. Firstly, the circRNAs were enriched by using different enrichment methods. Subsequently, the libraries were sequenced on an Illumina Hiseq 4000 platform and circRNA identified.
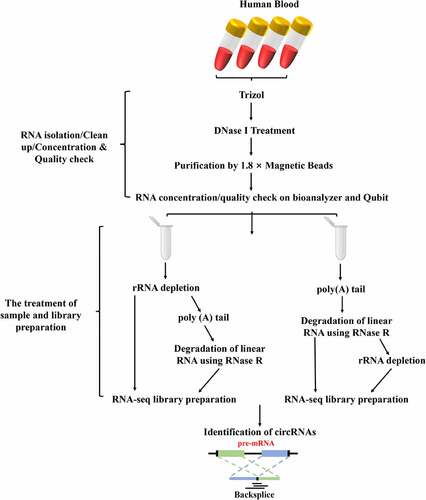
Figure 2. The validation of linear RNA removal efficiency using four diverse circRNA enrichment methods. (a) A schematic illustration for the design of the primers used to enrich for circRNA and their corresponding mRNA. circRNA: primers facing outwards; linear RNAs: primers facing inwards. (b) Subsets of blood circRNAs and mRNAs were quantified by qPCR by diverse enrichment methods. each data represents the mean of three replicates. statistical significance was assessed by student’s t-test. bars assigned with different letters are significantly different (P < 0.05).
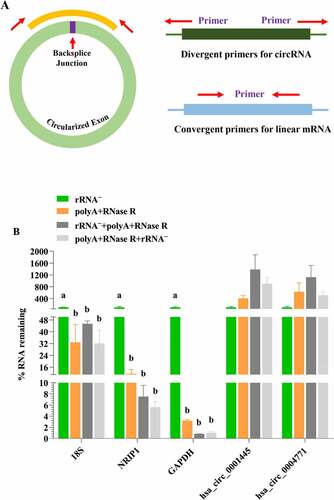
Table 2. The complexity of libraries using different circRNA enrichment methods
Figure 3. Descriptive characteristics of mapped reads. (a) read alignment and assignment rates per circRNA enrichment methods; (b) percentage of reads mapped to exonic and intronic regions per circRNA enrichment methods. each data represents the mean of three replicates. statistical significance was assessed by student’s t-test. bars assigned with different letters are significantly different (P < 0.05).
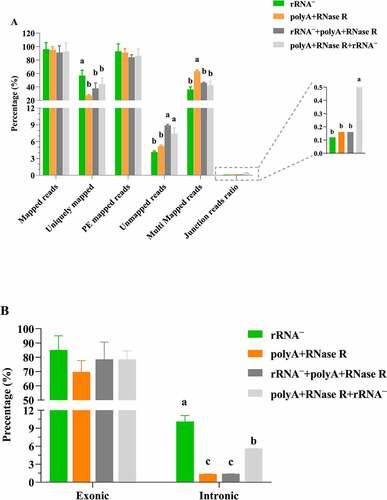
Figure 4. Identification and characterization of circRNAs by using four diverse enrichment methods. (a) the upset plot shows the distribution of identified circRNAs by using four diverse enrichment methods. The bar chart above represents the number of circRNAs contained in each enrichment method. The bar chart at the bottom left represents the number of identified circRNAs included in each enrichment method. The dotted line at the bottom right shows the number of identified circRNAs each enrichment method. One dot represents the circRNAs identified by one of the circRNA enrichment method. Two dots represents the circRNAs identified by two of the circRNA enrichment method. Three dots represents the circRNAs identified by three of the circRNA enrichment method. Four dots represents the circRNAs identified by four of the circRNA enrichment method; (b) The number of overlap circRNAs by comparing of diverse circRNA enrichment methods and circBase; (c) Number of identification circRNAs and novel circRNAs; (d) The distribution of circRNAs, intron circRNAs and intergenic_region circRNAs in each treatment sample. Data are shown as means ± SEM.
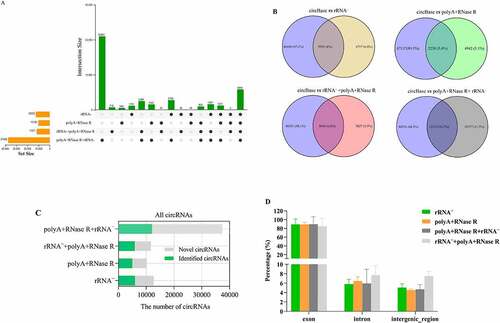
Figure 5. The analysis of circRNAs identification sensitivity, precision and correlation by using four diverse enrichment methods. (a) Sensitivity for detecting circRNAs at diverse enrichment methods; (b) Precision for detecting circRNAs at diverse enrichment methods; (c) F1-score for detecting circRNAs at diverse enrichment methods; (d) Heatmap showing Pearson correlation of log2 transformed count values (blue indicates low correlation and white indicates high correlation); (e) PCA plot show global expression pattern for each circRNA enrichment sample; (f) Scatter plots show correlation between the two replicates for each circRNA enrichment methods. R2 indicates coefficient of determination.
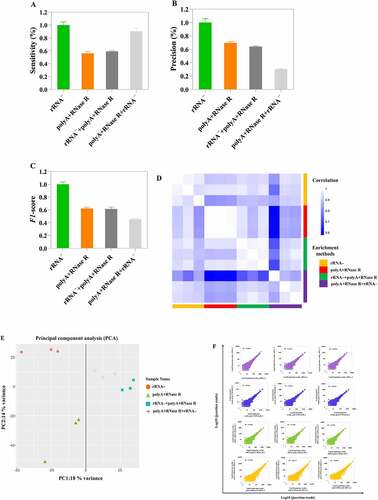
Figure 6. On diverse circRNA enrichment methods, the candidates circRNA of backspliced junction reads ≥ 2 were extracted. Then, these circRNAs were used in the cluster analysis by log2N processing, where N is the readcount. Each column represents detection of a sample specific methods, and each row corresponds to a circRNA.
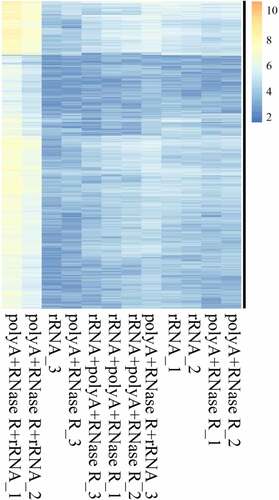
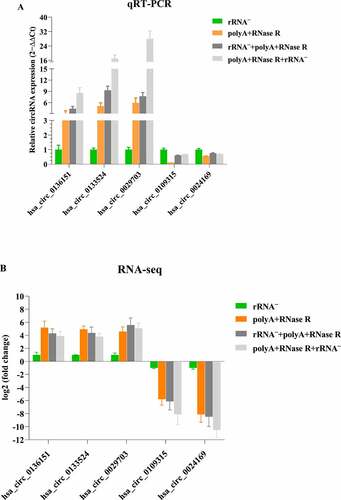
Figure 7. qPCR validation of diverse circRNA enrichment methods. (a) qPCR validation of five differentially expressed circRNAs in four diverse circRNA enrichment methods. (b) The RNA-seq result of five differentially expressed circRNAs by using four diverse circRNA enrichment methods. Data are shown as means ± SEM.