Figures & data
Figure 1. Dual centrifugation as a cell lysis method to produce translation-competent lysates. A. Schematic representation of DC. During DC, the samples rotate simultaneously around two axes of symmetry. Dashed arrows indicate the direction of centrifugal acceleration. B. Graphical overview of the steps for the production of translation-competent lysates using DC.
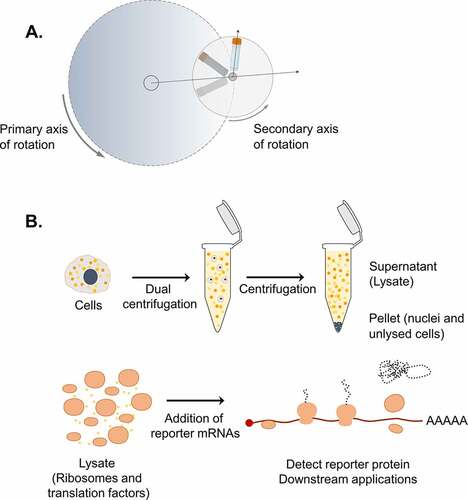
Figure 2. Dual centrifugation allows for the production of cytoplasm-enriched lysates. A. Assessment of lysis efficiency by Trypan Blue staining under the light microscope at 10x or 40x magnification. B. Western blot analysis of cytoplasmic and nuclear markers of the supernatant (lysate) and the pellet of DC-treated cells. Cytoplasmic and nuclear fractions were prepared using an alternative method of biochemical fractionation. All samples correspond to 6.8 μg protein.
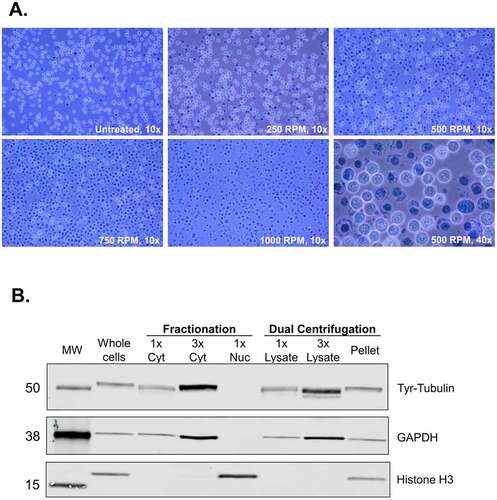
Figure 3. Optimization of lysate preparation and in vitro translation A. In vitro translation using lysates that were produced under different DC conditions. B. MgCl2 titration for in vitro translation reactions. C. In vitro translation using different mRNA concentrations. D and E. Time-course of RLuc in vitro translation reactions. For all experiments (except C), 5 fmol/μl of RLuc mRNA was used. For all panels, RLuc activity measurements are depicted as arbitrary units (AU) of luminescence. Each dot depicts the value of an individual experiment, and in vitro translation (biological replicate) was measured three times (technical replicates). Mean values and SD are shown.
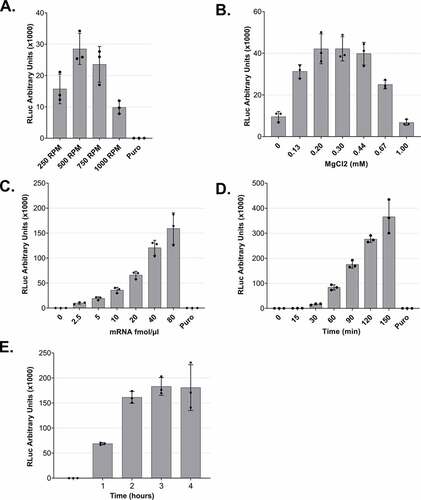
Figure 4. Cap- and IRES-dependent translation of dual centrifugation-derived lysates and comparison to rabbit reticulocyte lysate A. Comparison RLuc measurements of in vitro translation reactions of DC-generated lysates with uncapped (-Cap) or capped (+Cap) mRNAs. B. Comparison of Firefly Luc (FLuc) measurements of in vitro translation reactions of DC-generated lysates using dual-luciferase reporters with or without an ECMV-IRES upstream of the FLuc ORF. C. In vitro translation using Rabbit reticulocyte lysate (RRL) and three HeLa S3 lysates. Luc activity measurements are depicted as arbitrary luminescence units (AU). The dots depict the values of three individual experiments (biological replicates) that were measured each three times (technical replicates). In vitro translation experiments were performed using 5 fmol/μl mRNA reporters.
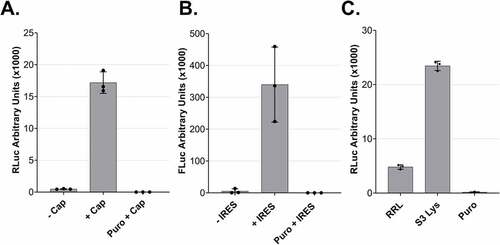
Figure 5. Cell lysis in a translation-competent buffer and of frozen cells and in vitro translation of different mRNA reporters A. Comparison of lysates produced using a hypotonic lysis buffer complemented with components required for in vitro translation (hypotonic lysis) versus lysis in a translation-competent buffer (translation comp lysis). B. Comparison of lysates produced using a hypotonic lysis buffer complemented with components required for in vitro translation (hypotonic lysis) from freshly harvested cells versus from frozen cell pellets. For A and B, RLuc activity measurements are depicted as arbitrary luminescence units (AU). Each dot depicts the value of an individual experiment and in vitro translation (biological replicate) that was measured three times (technical replicates). Mean values and SD are shown. C-E. Western blot analysis of time-course of in vitro translations of different mRNA reporters using lysates produced in translation-competent buffer. For C and D 1.6 μl and for E 1.25 μl of the translation reactions were loaded on the gel. In vitro translation experiments were performed using 10 fmol/μl RLuc reporter, a final amino acids concentration of 0.01 mM and without preincubating the translation reactions before adding the reporter mRNAs.
Figure 6. In vitro dephosphorylation of eIF2α leads to increased translation output. A. Western blot analysis of extracts from growing cells and translation-competent lysates against eIF2α and P-eIF2α (Ser51). All samples correspond to approx. 2.5 × 10⁵ cell equivalents. B. Comparison of RLuc measurements of in vitro translation reactions of DC-derived lysates in the absence (Control) or the presence of 0.5 mM GADD34 Δ240 and 3 mM 2-aminopurine. RLuc activity measurements are depicted as arbitrary units (AU) of luminescence. The dots depict the values of three individual experiments (biological replicates) that were measured each three times (technical replicates). C. Western blot analysis of lysates after in vitro translation against eIF2α, P-eIF2α and RLuc of non-supplemented lysate (No sup.), the addition of protein reconstitution buffer (Buffer), 0.5 mM GADD34 Δ240, 3 mM 2-aminopurine, 0.5 mM GADD34 Δ240 in combination with 3 mM 2-aminopurine or treated with puromycin. All samples correspond to 3 × 10⁵ cell equivalents. In vitro translation experiments were performed in lysates produced using translation-competent buffer using 10 fmol/μl RLuc reporter without preincubating the translation reactions before adding the reporter mRNAs. Asterisk denotes the position of full-length RLuc.