Figures & data
Table 1. Statistics of KJ201 genome
Table 2. Statistics of KJ201 transcripts analysed
Figure 1. Characteristics of AS in M. oryzae KJ201 under different conditions.
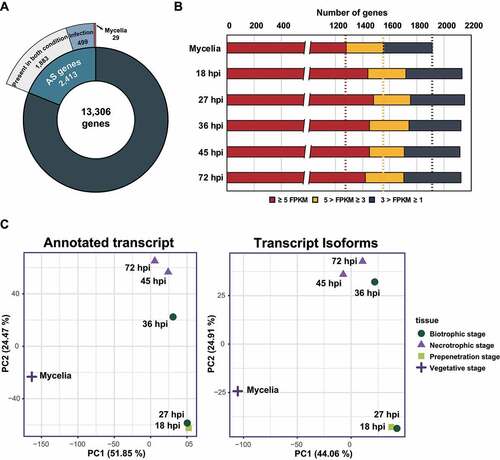
Figure 2. AS repertoires and the expression patterns of putative AS regulator genes under different conditions.
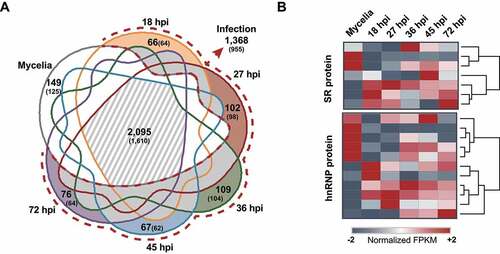
Figure 3. Three types of AS isoforms produced under different conditions and characteristics of Switching AS-type isoforms.
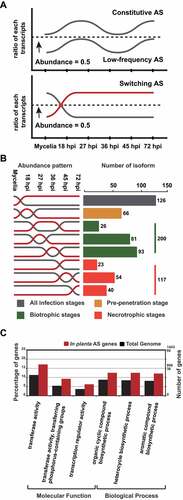
Figure 4. Four types of AS observed and their distribution patterns under different conditions.
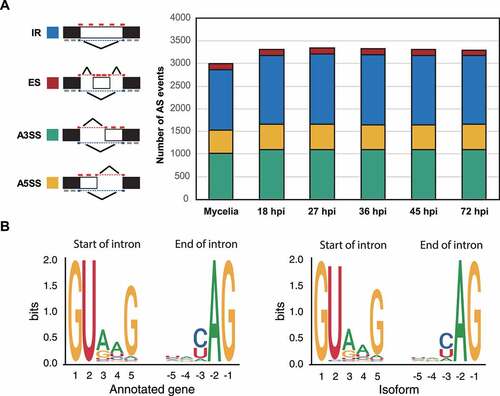
Figure 5. Domain variation patterns observed among the translated isoforms.
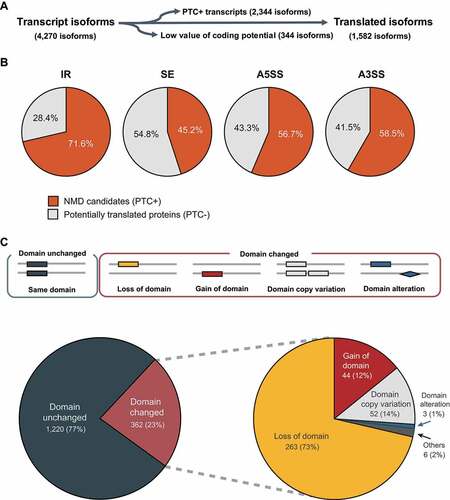
Figure 6. Predicted modifications of secreted proteins due to AS.
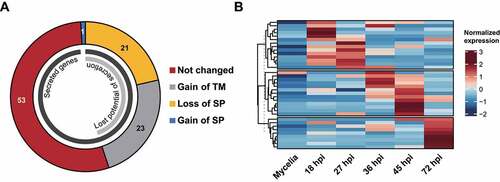
Table 3. List of the proteins produced using transcript isoforms generated via AS
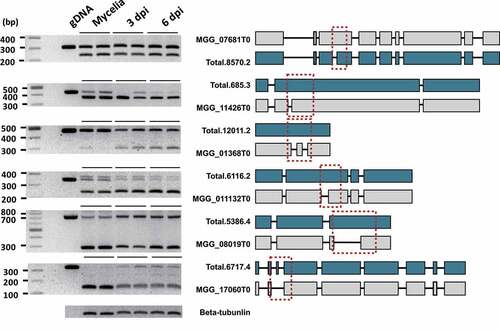
Figure 7. Validation of the transcripts produced via AS and the resulting structural changes.