Figures & data
Figure 1. The secondary structure model of BVDV IRES RNA derived from SHAPE-MaP probing. The three main domains are labelled (I–III) with outlined individual RNA motifs: SL Ia, SL Ib, SL Ic, SL II, SL IIIa, SL IIIb, SL IIIc, SL IIId1, SL IIId2, SL IIIe, SL IIIf, SL IIIg. The H-type pseudoknot has been manually inserted within the single-stranded residues at positions 381–387 and 410–416 of domain III. The residues lacking reactivity values correspond to the sites of primer annealing (light grey). The secondary structure is colour-coded according to the SHAPE reactivity values represented by low (< 0.25), medium (0.25–0.80), high reactivity (0.8–2), and hyperreactivity (>2).
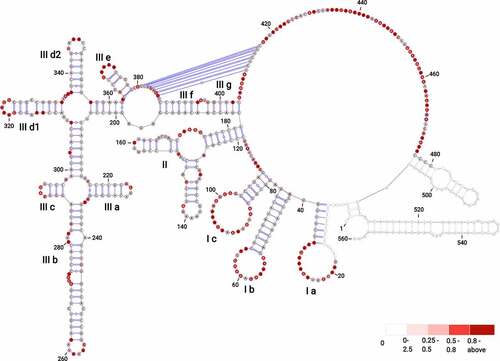
Figure 2. Structural features of BVDV IRES RNA. (A) Windowed SHAPE reactivities (black) and Shannon entropies (brown) are indicated. The X-axis represents the nucleotide position, and Y-axis corresponds to windowed SHAPE reactivities (top) and entropy values (bottom). Single-stranded regions involved in pseudoknot formation are indicated with grey rectangles. (B) Arc plots represent the base-pairing probabilities for BVDV IRES RNA. The top arc plot is colour-coded according to the pairing probability scale. The bottom arc plot includes the predicted H-type pseudoknot (red).
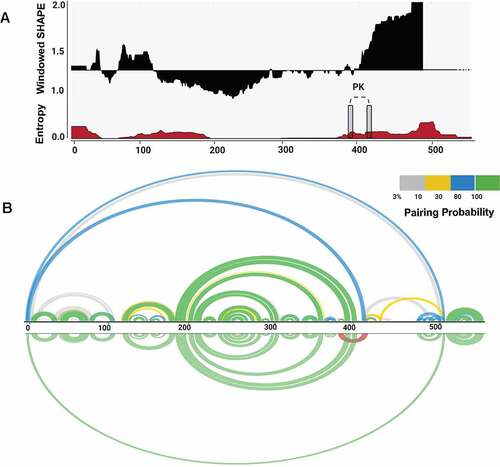
Figure 3. The consensus of IRES Domain III secondary structure prediction generated for 13 Pestivirus genomes highlights rich covariation patterns by the different colouring of base pairs, following the RNAalifold colour scheme. Red indicates nucleotide-level sequence conservation, while other colours highlight increasing covariation levels by structure-conserving nucleotide substitutes, as depicted in the insert. The model includes nucleotides with a frequency greater than the average in the underlying alignment in IUPAC notation. Dashes along the consensus sequence indicate positions where the majority of sequences had gaps. Circled nucleotides highlight compensatory mutations, i.e. cases where both nucleotides of a base pair are mutated, such as UA -> GC. Statistical significantly covarying base pairs are marked with an asterisk.
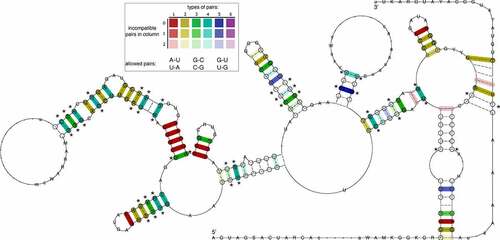
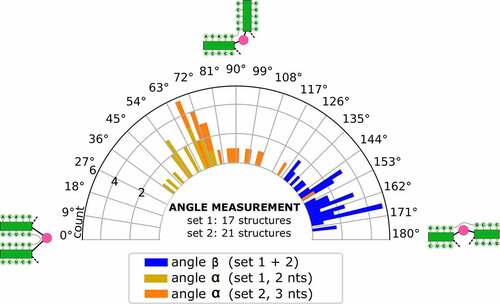
Figure 4. (A) Rendering of a low-energy tertiary structure snapshot of the truncated construct BVDVsegment_180_425 overlaid with coarse-grained 3D elements. Green cylinders highlight helical regions, with the rightmost representing H-type pseudoknot, and the middle and leftmost green cylinders portraying stem-loops IIIf and IIIg, respectively. The bulge between SL IIIf and IIIg is depicted in yellow, and the multiloop enclosed by the formation of the pseudoknot is plotted as a long red connection. The short red connection between the pseudoknot helix and SL IIIf represents a single unpaired C between these helices. Other structural elements are greyed out. The quasi-colinear arrangement of the pseudoknot and SL IIIf is noticeable, while the bulge induces a marked twist between SL IIIf and IIIg. (B) Schematic representation of the three helices encompassing the pseudoknot, SL IIIf, and IIIg, sketching their approximate spatial arrangement. Angles between adjacent helical segments are defined by stem vectors, i.e. angle α between SL IIIf and SL IIIg (orange and red vectors), and β between SL IIIf and the pseudoknot helix (blue vectors). The directionality of the backbone is indicated by black arrows. Regions of BVDVsegment_180_425, which are not directly involved in the spatial arrangement of these helices, are depicted as a dashed segment along the backbone.
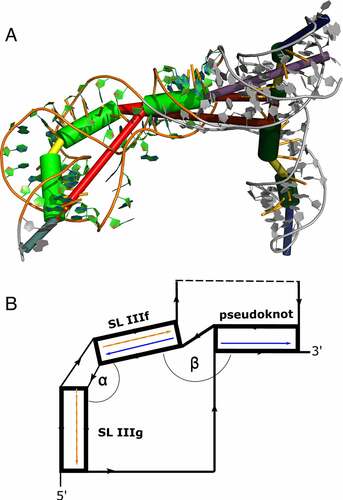
Figure 5. Distribution of angles α and β in the low-energy 3D structure of BVDVsegment_180_425. The relative orientation of helices was assessed by a helix-centred representation of RNA 3D structure. As stretched by the relative geometry of green helical segments, angles close to 0° account for parallel stems, whereas angles close to 180° indicate collinear arrangement and can be indicative of coaxial stacking. Analysis of candidate structures from SimRNA simulations of BVDVsegment_180_425 shows that angles between helices are distributed in well-defined intervals. Set 1 and set 2 comprise low-energy structures predicted by SimRNA, whose helices SL IIIf and IIIg are separated by a bulge of 2 and 3 nts, respectively. For set 1, α lies between 37 and 75 degrees, while for set 2, values are distributed between 66 and 149 degrees. This is expected, as a larger bulge allows for more conformational flexibility of the two adjacent helices. Contrary, β falls in a range between 130 and 174 degrees for set 1 and 129 and 173 degrees for set 2. Values for both sets were combined and depicted in blue.