Figures & data
Figure 1. Nucleoporins TbNup62 and TbNup144 are essential for cell survival. (A) Schematic representation of the studied Nups within the NPC. Growth curves of the procyclic form of T. brucei, wild-type (WT; triangle), non-induced (-TET; square), and RNAi-induced (+TET; circle) cell lines of (B) TbNup62 and (C) TbNup144. Three biological repeats were performed, and the average of three experiments was plotted. Mean ±SD is shown. Inset: RT-PCR analysis showing the downregulation of the mRNA levels and loading control.
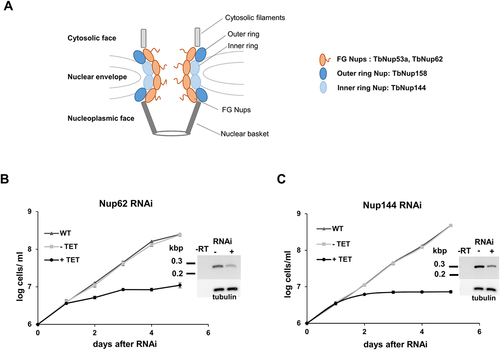
Figure 2. Downregulation of nucleoporin TbNup62 affects nuclear export of tRNAAsp, while TbNup144 does not affect tRNAAsp trafficking. (A) To determine the subcellular localization of mature tRNAAsp in WT, non-induced (-TET) and RNAi-induced (+TET) TbNup62 and TbNup144 cells fluorescent in situ hybridization was performed. Micrographs show the subcellular localization of mature tRNAAsp (red-Cy3). DAPI (blue) was used to stain the kinetoplast and nucleus DNA. Bars, 5 µm. (B) Quantification of the fluorescence intensity of tRNAs (orange) and DAPI (blue) in non-induced and 28 hr RNAi-induced TbNup62 and TbNup144 cell lines. Each graph shows the intensity profile of individual fluorophores (orange-tRNAAsp, blue-DNA) of 6 randomly selected cells, representing the relative intensity average ±SD.
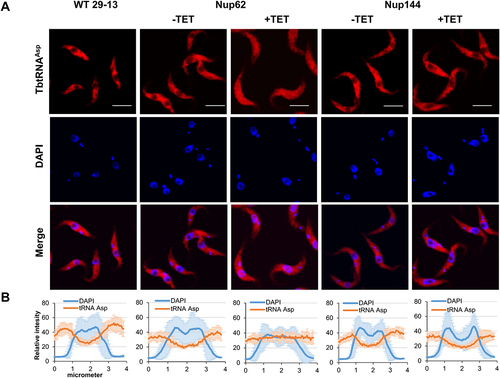
Figure 3. Downregulation of nucleoporin TbNup62 affects nuclear export of tRNAPhe, while TbNup144 does not affect tRNAPhe trafficking. (A) To determine the subcellular localization of mature tRNAPhe in WT, non-induced (-TET) and RNAi-induced (+TET) TbNup62 and TbNup144 cells fluorescent in situ hybridization was performed. Micrographs show the subcellular localization of mature tRNAPhe (red-Cy3). DAPI (blue) was used to stain the kinetoplast and nucleus DNA. Bars, 5 µm. (B) Quantification of the fluorescence intensity of tRNAs (orange) and DAPI (blue) in non-induced and 28 hr RNAi-induced TbNup62 and TbNup144 cell lines. Each graph shows the intensity profile of individual fluorophores (orange-tRNAPhe, blue-DNA) of 6 randomly selected cells, representing the relative intensity average ±SD.
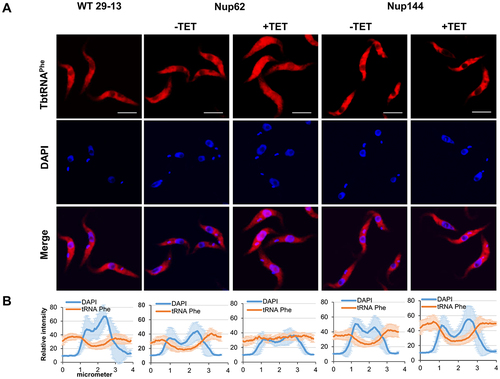
Figure 4. The TbNup62 has role in the primary export of intron-containing tRNA, while subcellular localization of mature tRNATyr is not affected (A) Total RNA was isolated from wild-type (WT), non-induced (-TET), and RNAi-induced (+TET) cells (TbNup62, TbNup144), and Northern hybridization was performed with a tRNATyr-intron and tRNATyr-3’ exon probe to detect intron-containing and/or mature tRNA. Trl1 RNAi-induced cells were used as a positive control for detection of intron-containing tRNATyr. tRNAGlu was used as a loading control for the experiment. The blots are representative of three independent experiments. The higher faint band, which is present in all cell lines tested, is a result of unspecific hybridization (marked with an asterisk). (B) To determine the subcellular localization of mature tRNATyr in WT, non-induced (-TET) and RNAi-induced (+TET) TbNup62 cells fluorescent in situ hybridization was performed. Micrographs show the subcellular localization of mature tRNATyr (red-Cy3). DAPI (blue) was used to stain the kinetoplast and nucleus DNA. Bars, 5 µm. Panel below the micrographs shows quantification of the fluorescence intensity of tRNAs (orange) and DAPI (blue) in non-induced and 28 hr RNAi-induced TbNup62 cell line. The graphs under each column show the intensity profile of individual fluorophores (orange-tRNATyr, blue-DNA) of 6 randomly selected cells of that cell line, where the values represent the relative intensity average ±SD. (C) Total RNA was collected after 28 hr of RNAi induction. Boronate affinity electrophoresis – Northern blotting was carried out for RNAi-induced (+TET) and non-induced (-TET) cells. Probes for tRNATyr 3’ exon were used to determine Q levels. ‘ox’ refers to an oxidized control; oxidation of the cis-diols from Q prevents the observed band shift. tRNAGlu probe was used as a loading control. Numbers under the blot indicate % Q tRNA modification levels, compared to total tRNATyr levels.
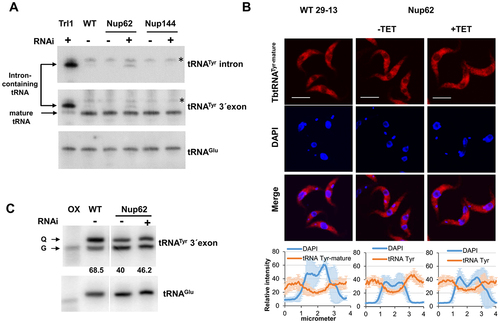
Figure 5. Downregulation of nucleoporin TbNup144 causes a severe defect in nuclear division. (A) Quantification of nuclear (N) kinetoplast (K) ratio in parental (WT), non-induced (-TET) and 28 hr RNAi-induced (+TET) TbNup62 and TbNup144 cells. 300 cells from each condition were counted to categorize the distinct stages of the cell cycle. TbNup144 RNAi-induced cells show an increased number of 2K1N cell types, suggesting arrest in the G2/M phase. Right panel: Example specimen of procyclic form of T. brucei during different cell cycle stages with the different kinetoplast (K) and nucleus (N) content. 1K0N and 1K2N are cell types with aberrant cytokinesis. (B) Determination of the length of the nucleus. 100 cells from each cell line were used to measure the length of the nucleus from the posterior to the anterior pole of the nucleus. Downregulated TbNup144 (+TET) shows a significant change in the size of the nucleus compared with un-induced (-TET) or parental cell line (** p < 0.0001). (C) Representative micrographs showing the 2F2K1N cell type after 28 h RNAi-induction of TbNup144 cell line. To determine the cell cycle phase of WT and RNAi-induced TbNup144 cells, immunofluorescence was performed. Antibody mAb62 (green) detecting the flagella connector on the tip of the new flagella and DAPI (blue) staining showing the differences of kinetoplast and nucleus content between parental (WT) and RNAi-induced TbNup144 cells. Arrows point to the cells containing new and old flagella.
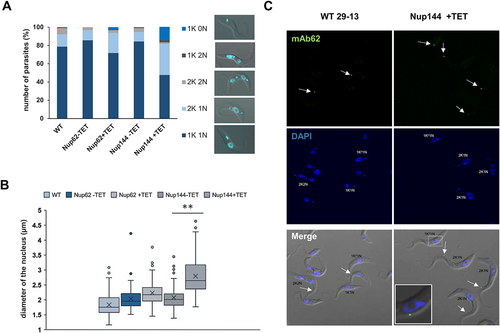
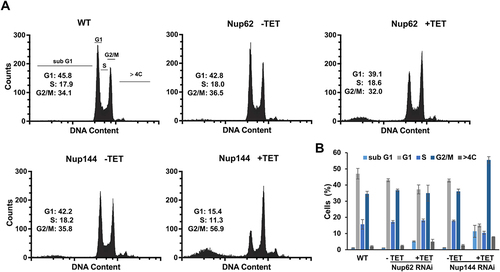
Figure 6. Silencing of TbNup144 but not of TbNup62 causes cell cycle arrest in the G2/M phase. (A) Flow cytometry profiles of parental (WT), non-induced, and RNAi-induced TbNup62 and TbNup144 cells. To determine the karyotype of the population, cells were fixed and stained with propidium iodide (indicating DNA content) (x-axes). Cell count is plotted on the y-axes. Downregulation of TbNup144 shows arrest in the G2/M phase (2K1N), suggesting that cell lines after induction encounter errors in completing mitosis and cytokinesis. Three biological repeats were performed, and representative histograms are shown. Inset: Percent of cells in G1, S and G2/M are shown. (B) Densitometry analysis of the cell cycle phases (sub-G1, G1, S, G2/M, >4C). Mean scores from three biological replicates are plotted, and ±SD is shown.