Figures & data
Figure 1. Schematic showing the structure of 3’-end chimeric oligonucleotides (upper panel) and 5’-end chimeric oligonucleotides (lower panel).
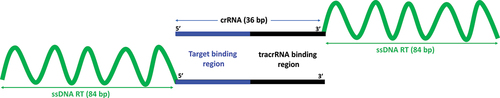
Figure 2. Gene editing rates as determined by ICE analysis for (A) 3’-end oligonucleotides (chimera 1 for KRAS G35A and chimera 2 for KRAS 183C) with symmetric ssDNA RTs and 5’-end chimeric oligonucleotides (chimera 3 for KRAS G35A and chimera 4 for KRAS 183C) with symmetric ssDNA RT. Data for TP53 G374T is not shown since no editing is obtained. Data is obtained from three independent experiments. Error bars show mean ± SEM. Representative ICE analysis output is shown for (B) a 3’-end chimeric oligonucleotide (chimera 2) and (C) a 5’-end chimeric oligonucleotide (chimera 4).
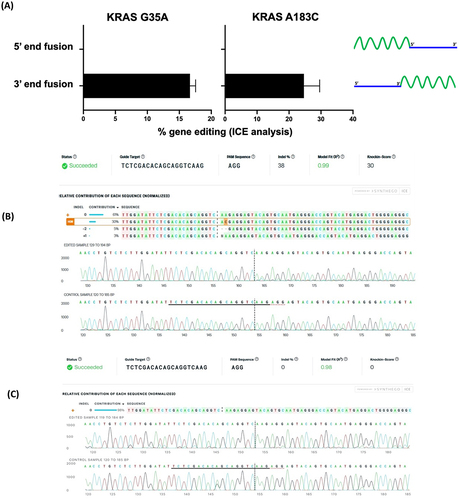
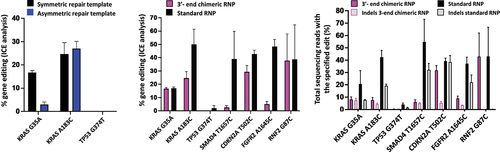
Figure 3. Gene editing rates as determined by ICE analysis (A) for editing with 3’-end chimeric RNPs with symmetric or asymmetric repair templates and (B) for the comparison of editing rates between 3-‘end chimeric RNPs with symmetric repair template and standard RNPs with co-delivered symmetric ssODN and (C) gene editing rates as determined by NGS. For comparison, the data using the chimeras with symmetric DNA repair template for KRAS G35A, KRAS A183C and TP53 G374T in (A) and (B) is the same data as the data depicted in . Data is obtained from three independent experiments. Error bars show mean ± SEM.