Figures & data
Figure 1. Introduction of mRNA translation. (a) The process of translation initiation and elongation. (b) Translation initiation rate eventually determines the number of protein molecules produced per mRNA, and therefore is the rate-limiting step in translation. (c) Complex RNA structure near start codon would reduce translation (initiation) efficiency. (d) Allele frequencies (AFs) of different mutation sites are compared in many literatures. This comparison is horizontal. In contrast, the vertical comparison of AF of a mutation along time is still lacking. Each bar represents the AF of each mutation. Different mutations have different colours.
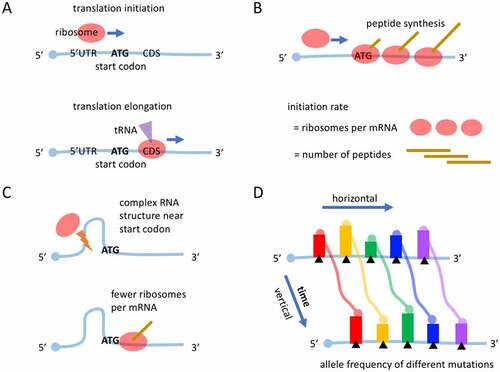
Figure 2. The relationship between GC content, minimum free energy (MFE, in silico) and RNA structure (icSHAPE score, in vivo). (a) The GC content, MFE and icSHAPE score across the 30K SARS-CoV-2 genome. 500 bp sliding window with step size = 100 bp are used. The locations of the 11 SARS-CoV-2 genes and the annotations of 5ʹUTR and CDS are shown. Lower MFE or lower icSHAPE score represent stronger RNA structure. (b) Spearman correlation between MFE and GC content, and between icSHAPE score and GC content.
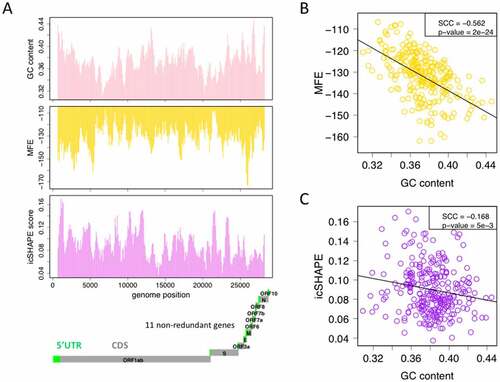
Figure 3. Characteristics of standing variations and novel mutations. (a) The 16 time points (TPs) are equally distributed during an 8-month period. The AF of mutations is calculated at each TP. (b) Definition of standing variation and novel mutation. We require a novel mutation to have AF = 0 at both TP1 and TP2, and a standing variation to have AF > 0 at TP1. (c) The mean AF of all mutations within each gene. Standing variations obviously have higher AF than novel mutations. (d) Novel mutations have higher fraction of missense mutations than standing variations. ***p-value < 0.001 by Chi-square test.
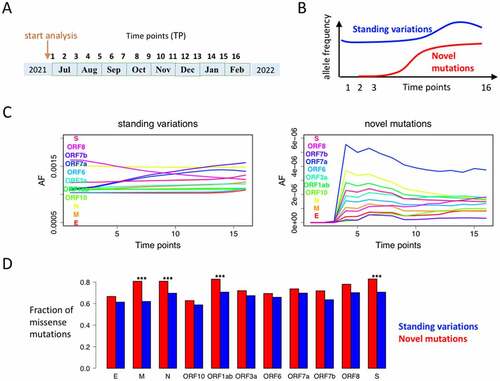
Figure 4. Mutations that decrease or increase the GC content. (a) The percentages of mutations that increase, decrease, or do not change the GC content. (b) For the standing variations in 5ʹUTRs, the ones that decrease GC content (orange) are increasing their AF along time. (c) For synonymous mutations among the standing variations, only the ones located in the 5-prime of CDS have the same pattern as 5ʹUTR mutations (where decreasing GC is favourable and increasing GC is unfavourable). Because synonymous mutations in the gene body are also affected by codon usage bias, only the most 5-prime part could be used to analyse RNA structure.
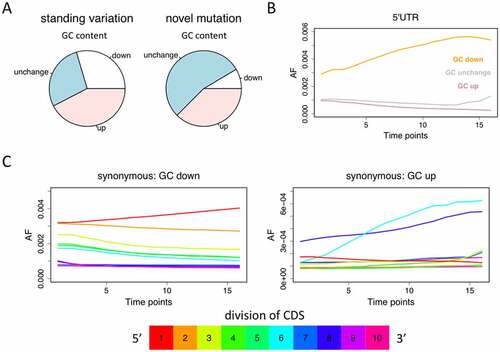
Figure 5. Novel mutations also prefer less RNA structure near start codon. All mutations are classified into GC-down, GC-up, and GC-unchanged. (a) Dynamics of novel mutations in 5ʹUTR. (b) Synonymous mutations in the first 1/10 of CDS. (c) Synonymous mutations in the last 1/10 of CDS. (d) Dynamics of novel missense mutations.
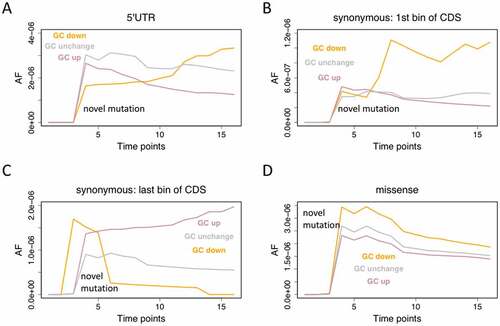
Figure 6. Defining adaptive and deleterious mutations and their selection patterns regarding GC content. (a) Diagram showing the scheme of calculating Spearman correlation coefficient (Rho) of each mutation site based on AF at different time points. Standing variations and novel mutations were calculated separately. (b) The density distribution of Rho and the definition of adaptive and deleterious mutations. (c and d) The numbers and percentages of each category of mutations. The percentages are calculated within each colour in the same plot, the purpose of which is to show that GC-down mutations near start codons are adaptive (due to selection on translation initiation) while GC-up mutations are favoured at the end of CDS (possibly due to selection on codon usage bias). *p-value < 0.05; **p-value < 0.01; ***p-value < 0.001 by Chi-square tests.
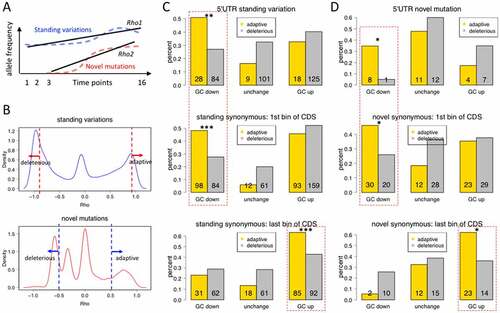
Figure 7. MFE before and after mutations. (a) 5ʹUTR and the first bin of CDS are concatenated. The MFE of each variant sequence is calculated. The adaptive and GC-down mutations are used. A full replacement sequence is also created. (b) Distribution of the MFE of the variant sequences. The MFE values of original sequence and full replacement sequence are highlighted as red triangles.
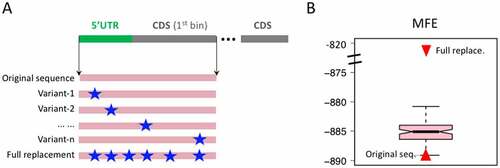
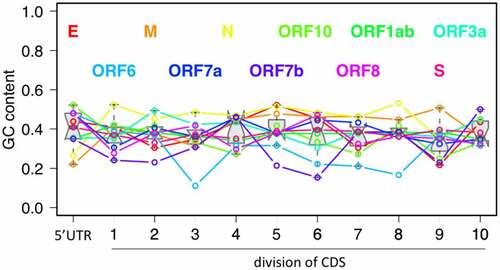
Figure 8. GC content of 5ʹUTR and each division of CDS. CDS bins are divided with equal length within each gene. Each gene has a unique colour in the plot. For each bin, a box-whisker is drawn to show the distribution of 11 genes.