Figures & data
Table 1. Demographics and characteristics of melanomas used in this study.
Figure 1. Gene expression analysis of cell lines from patients based on mutation status, treatment and survival. (A) Heat map (left) and PCA plot (right) representation of gene expression in cell lines from 66 patients divided into 3 treatment groups: relapsing after immunotherapy, after targeted therapy or prior to any therapy ‘no therapy’ showed 42 differentially expressed genes ranked based on q values obtained through multivariant analysis limma and voom. (B) Heat map (left) and PCA plot (right) representation of gene expression in cell lines from 55 patients divided into 3 survival groups showed 77 differentially expressed genes ranked based on q values obtained through multivariant analysis limma and voom. The gene FAM84A is now known as LRATD1, AC104653.1 as ACTR3-AS1, C19orf43 as TRIR, HRSP12 as RIDA, MICALCL as MICAL2, CTD-2210P24.3 as LINC02690 and FAM206A as ABITRAM.
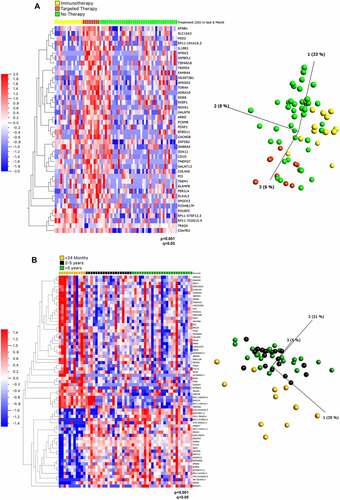
Figure 2. Comparison of A-to-I editing index and recoding editing index among 3 clinical groups: mutation, treatment and survival. (A) Alu editing index of 66 patients grouped into three mutation groups: BRAF, NRAS and other (which included WT (4), cKIT (4), GNAQ (1) and GNA11 (1). Note one patient sample was excluded from analysis as it harboured a double mutation. (B) Alu editing index of 66 Patients grouped into three therapy groups: after immunotherapy, after targeted therapy or prior to any therapy ‘No therapy’. Note one sample with both immunotherapy and targeted therapy treatment prior to biopsy was excluded. (C) Pearson correlation coefficient of editing versus survival in 37 patients. Note living patients (n = 30) were excluded from analysis. (D–F) Differences in the Recoding Editing Index (REI), defined as the weighted average over all known recoding sites from the REDIportal database, were analysed in the three clinical groups: mutation status (D), therapy response (E) and survival (F). One-way ANOVA analysis and Pearson correlation showed no significant differences in AEI among the clinical groups. One-way ANOVA analysis showed no significant differences in the REI in all groups tested.
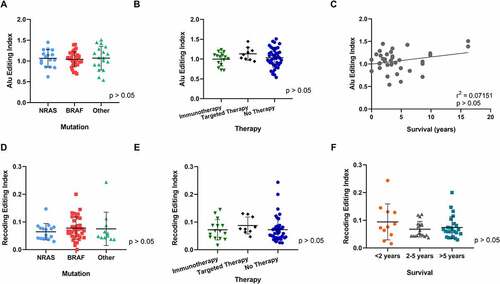
Figure 3. Comparison of A-to-I editing among 3 clinical groups: mutation, treatment and survival. Editing frequency comparison was performed in non-repetitive regions and Alu repetitive elements in the three clinical groups: mutation status, therapy response and survival. (A) One-way ANOVA analysis showed significant differences in A-to-I Editing of the MOK gene in non-repetitive regions in tumours from patients who relapsed during targeted therapy. (B) Pearson Correlation of MOK editing with ADAR1 gene expression showed no statistical significance. (C) No correlation of MOK A-to-I editing in non-repetitive regions with gene expression. (D) One-way ANOVA analysis showed significant differences in A-to-I Editing of the ZBTB11 gene in Alu regions in tumours from patients in the NRAS mutation group. (E) Positive Correlation of ZBTB11 A-to-I editing with ADAR1 gene expression. (F) Positive correlation of ZBTB11 A-to-I editing with ZBTB11 gene expression.
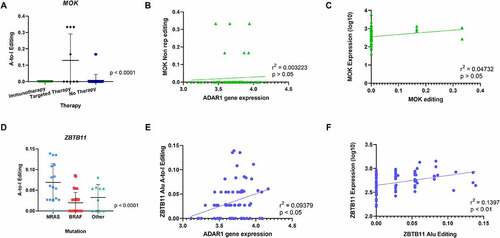
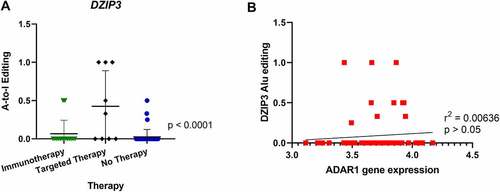
Figure 4. Comparison of A-to-I editing of DZIP3 and correlation with ADAR1 expression. (A) One-way ANOVA analysis showed significant differences in A-to-I editing of the DZIP3 gene in Alu regions in tumours from patients relapsing after targeted therapy. (B) Pearson correlation of DZIP3 Alu editing with ADAR1 gene expression showed no statistical significance.