
Figures & data
Figure 1. Overview of alternative splicing (AS) and prognosis-related AS events in ovarian cancer (OV).
AA, alternate acceptor; AD, alternate donor; AP, alternate promoter; AT, alternate terminator; ES, exon skip; ME, mutually exclusive exons; RI, retained intron. (a) The upset plot displayed seven types of AS events in OV. (b) The upset plot of prognosis-related AS events. (c) Volcano plot of prognosis-related AS events.
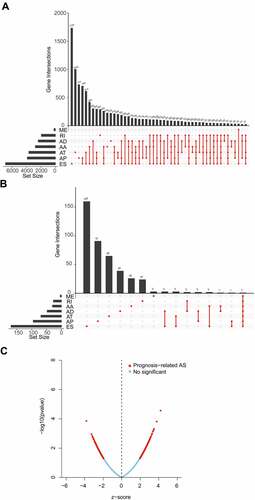
Figure 2. The top 20 most significant prognosis-related AS events in seven types of AS. (a) AA, (b) AD, (c) AP, (d)AT, (e)ES, (f)ME, (g) RI.
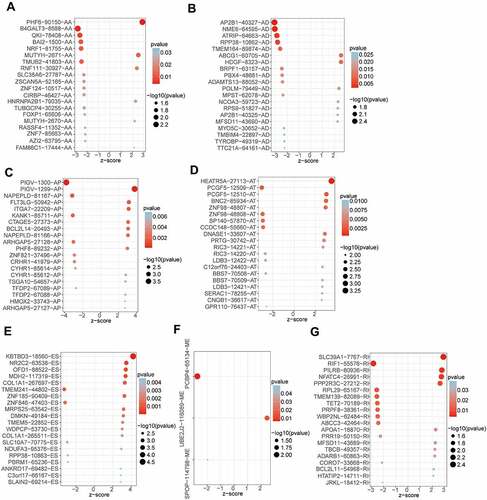
Figure 3. Construction and validation of AS prognostic risk model.
(a-b) LASSO Cox regression analysis of top 20 most significant prognostic AS events. (c-d) The distribution of risk score, overall survival (OS) and life status for the OV patients in the training set. (i) The expression heatmap of the most eight significant prognosis-related AS events in the training set. (e-f, j) Survival time, risk score distribution, and expression heatmap of AS events in validation set 1; (g-h, k) Validation set 2.
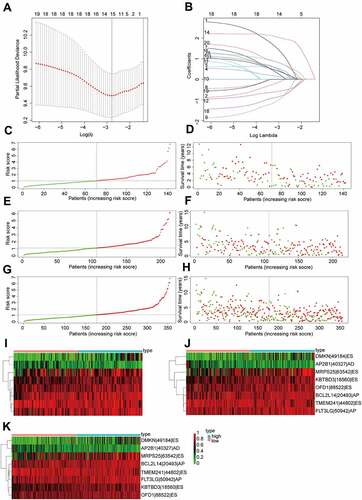
Figure 4. The risk score was closely related to the OV prognosis.
Kaplan–Meier (K-M) curve (a), receiver-operating characteristic (ROC) analysis (d) and multiROC (g) of the risk score in the training set. (b, e, h) validaion set 1. (c, f, i) validaion set 2.
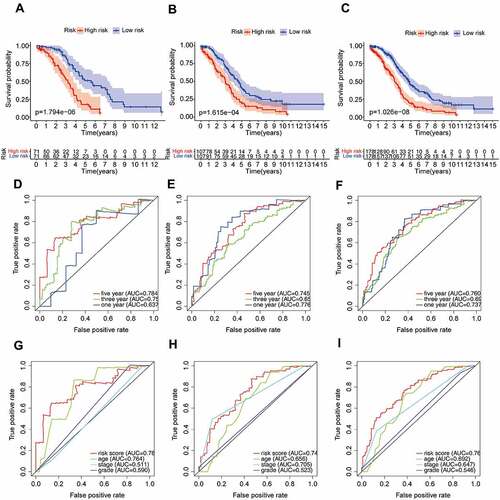
Figure 5. The risk score was an independent predictor of overall survival.
Univariate (a) and multivariate (d) Cox regression analysis of clinical features and risk score in the training set. (b, e) validaion set 1. (c, f) validaion set 2.
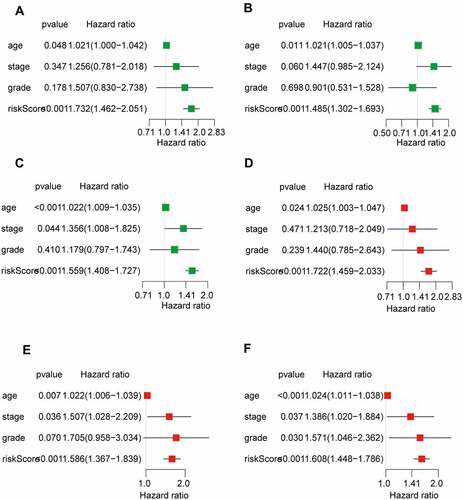
Figure 6. Establishment of OS nomogram.
(a) Nomogram for predicting OS of OV. Concordance index (b) and calibration curve (c) of the nomogram. The ROC curve (d) analysis and K-M plot (e) of the clinically applicable model. (f) The interaction network between SF and AS events.
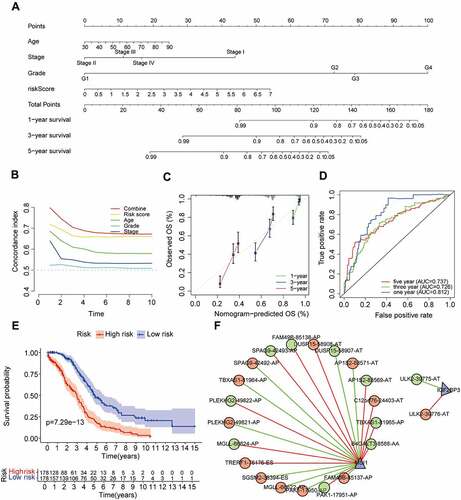
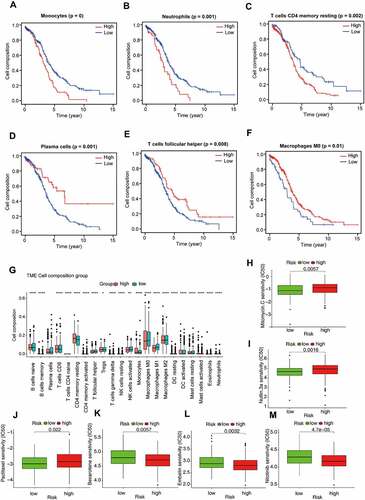
Figure 7. Immune cell infiltration and chemosensitivity of OV patients.
The K-M plot of immune cell in OV patients. Patients with high infiltration of monocytes (a), neutrophils (b), and T cells CD4 memory resting (c) often predicted poor prognosis. Patients with high plasma cells infiltration (d), T cells follicular helper (e) infiltration, and macrophages M0 (f) infiltration had a better prognosis. (g) Comparison of 22 immune cell infiltration between the high-risk group and low-risk group. (h-m) IC50 of chemotherapy drugs (including Mitomycin C, Nutlin 3a, Paclitaxel, Bexarotene, Embelin, and Nilotinib) in different groups.
Supplemental material