
Figures & data
Figure 1. Recruitment of m6A RNA and m8A RNA to locally irradiated chromatin. (A) Localization of m6A RNA and m8A RNA in the nucleoplasm of non-irradiated and microirradiated HeLa cells. (B) Quantification of the density of m6A RNA and m8A RNA in the whole cell nuclei of non-irradiated and microirradiated cells. (C) m8A RNA was studied at DNA lesions of (a) non-treated cells, (b) after the treatment of Suv20h1/2 inhibitor A196 (A196i) affectioning H4K20me2/me3, after inhibition of RNA polymerases I and II (c) Actinomycin D and (D) α-amanitin. (E) We performed ATM depletion and (F) inhibition of DNA methyltransferase by 5-aza deoxycytidine. Inhibitors of histone deacetylases (HDACs) (G), suberoylanilide hydroxamic acid (Vorinostat; syn. SAHA), and (H) Trichostatin A (TSA) were studied. (I) PARP was inhibited by Olaparib. Regions of interest (ROI) are shown in white frames. Scale bars show 5 µm. (D, E) Quantification of m8A RNA at locally microirradiated chromatin in non-treated cells and after different treatments is shown. (F) Western blots show effects of selected treatments from panel C on the level of H4K20me2/me3, H3K9ac, and γH2AX. Data were normalized to the total protein levels and quantification is shown in panel (G).
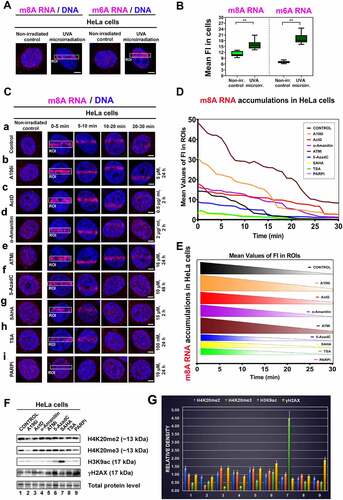
Figure 2. Accumulation of m8A RNA and m6A RNA to DNA lesion during interphase. Using the FUCCI cellular system expressing RFP-tagged cdt1 in the G1 phase and GFP-tagged geminin in the G2 phase of the cell cycle, we observed an accumulation of both (A) m8A RNA and (B) m6A RNA to microirradiated chromatin in G1, S, and G2 phases of the cell cycle. Quantification of (C) m8A RNA and (D) m6A RNA fluorescence intensity in irradiated regions of G1, S, and G2 cells.
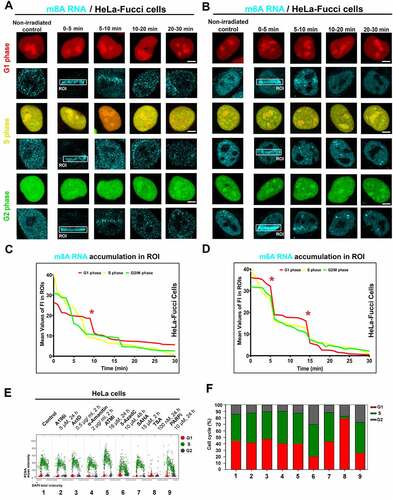
Figure 3. The level of m6A RNA in microirradiated regions and the effect of METTL3 inhibitor. (A) m6A RNA accumulated in microirradiated chromatin 0–5 min after laser exposure. (A, B) Quantification by ImageJ software shows that PARP inhibitor Olaparib reduced m6A RNA positivity at DNA lesions. (C-E) METTL3 inhibitors, STM2457 (see ref[Citation51].), reduced the level of m6A RNA at microirradiated chromatin. Regions of interest (ROI) are shown by rectangles or, in later phases of DDR, by arrows for better visibility. Statistically, significant differences are shown at p ≤ 0.01. Scale bars show 5 µm.
![Figure 3. The level of m6A RNA in microirradiated regions and the effect of METTL3 inhibitor. (A) m6A RNA accumulated in microirradiated chromatin 0–5 min after laser exposure. (A, B) Quantification by ImageJ software shows that PARP inhibitor Olaparib reduced m6A RNA positivity at DNA lesions. (C-E) METTL3 inhibitors, STM2457 (see ref[Citation51].), reduced the level of m6A RNA at microirradiated chromatin. Regions of interest (ROI) are shown by rectangles or, in later phases of DDR, by arrows for better visibility. Statistically, significant differences are shown at p ≤ 0.01. Scale bars show 5 µm.](/cms/asset/6bfdce0c-87d3-4113-898b-bd1240c47621/krnb_a_2139109_f0003_oc.jpg)
Figure 4. PARP inhibitor Olaparib abolished XRCC1 and APE1 recruitment to microirradiated chromatin, but no changes were observed in NER factors. (A) PAPRi did not change the levels of XPC and CPDs at DNA lesions, while Olaparib potentiates γH2AX positivity in the whole cell nuclei. Panel (B) shows quantification of fluorescence intensity of (a) γH2AX, (b) XPC, (c) CPDs in microirradiated chromatin. (C) PARPi causes an increase of γH2AX positive foci per cell. (D) PARPi prevents the recruitment of XRCC1 and APE1 to UVA-damaged chromatin but does not change the number of (E) XRCC1 positive foci. (F) The number of APE1 positive foci increased after PARP inhibition. Data are shown as the mean ± SE (standard error), and statistically significant differences are shown at p ≤ 0.01. (G) Treatment with an alkylating agent, Melphalan, increased the number of XRCC1-positive foci, but γH2AX positivity and m8A RNA level remained stable after Melphalan treatment.
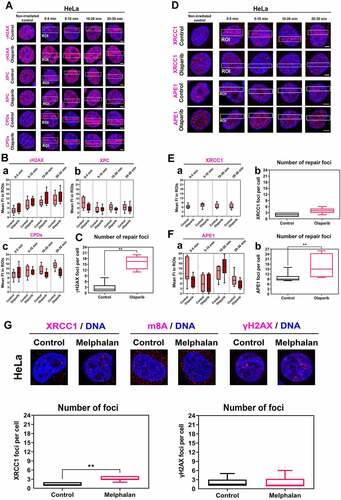
Figure 5. PARP inhibitor affects specific DNA repair foci and erases PARP1 positivity in microirradiated chromatin. (A) One hour after the cell treatment by PARPi, there was a low m8A RNA positivity at DNA lesions, and RNase H reduced the m8A RNA abundance in the whole genome. ATMi did not change the m8A RNA level in microirradiated chromatin. (B-C) PARPi significantly changed the number of (Ba, a’) 53BP1-, and (Cc, c’) MDC1-positive foci but did not change the number of (Bb, b’) 53BP1pS1778-, (Bc, c’) RIF1-, (Ca, a’) BRCA, (Cb, b’) RAD51-positive foci. Data are shown as the mean ± SE (standard error). Statistically, significant differences are shown at p ≤ 0.01. (D) PARP inhibitor reduced the level of PARP1 in both the whole genome and microirradiated genomic regions (ROI).
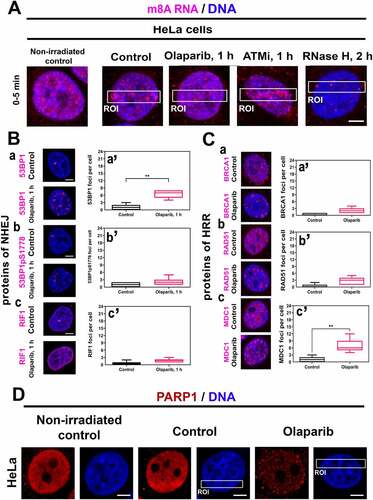
Figure 6. m8A RNA interacts with γH2AX and DNA. FLIM-FRET analysis showed a weak interaction between (A) m8A RNA and the XRCC1 protein but a significant interaction between (B) m8A RNA and γH2AX or (C) m8A RNA and DNA. (D) The FLIM-FRET efficiency for m8A RNA and BRCA1 was on the cut-off level, which is ~ 20%.
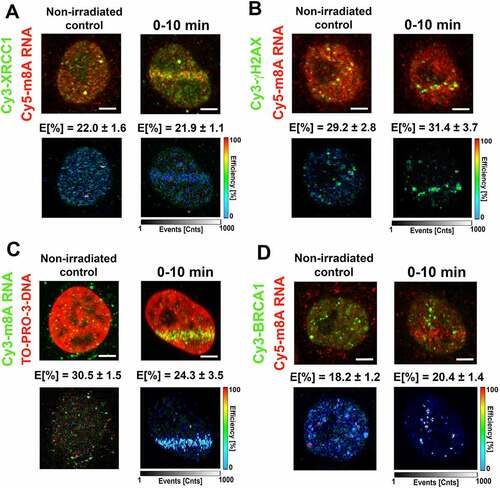
Figure 7. m6A RNA did not interact with γH2AX, DNA, and BRCA1. FLIM-FRET analysis showed a strong interaction between (A) m6A RNA and XRCC1, but no interaction was shown when analysing (B) m6A RNA and γH2AX or (C) m6A RNA and DNA or (D) m6A RNA and the BRCA1 protein. (E) Comparison of interaction properties in the following interaction partners: m8A RNA-XRCC1; m8A RNA-γH2AX, m8A RNA- DNA, and m8A RNA-BRCA1 and m6A RNA-XRCC1; m6A RNA-γH2AX, m6A RNA- DNA, and m6A RNA-BRCA1.
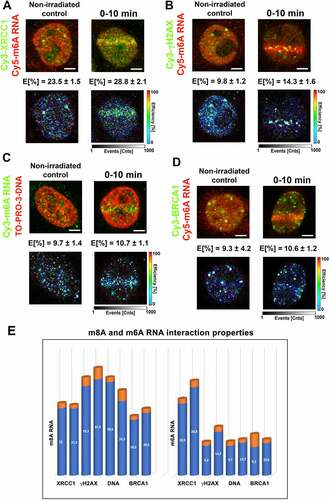
Figure 8. The active DNA demethylation in microirradiated chromatin. (A) nuclear distribution pattern of 5mC was studied in the microirradiated genome. (B) The level of 5hmC at locally induced DNA lesion is shown, similarly to (C) the level of 5caC. (D) TET1, TET2, and TET3 protein levels were studied in DNA lesions induced by UV laser in HeLa and MEFs cells. Scale bars show 4 µm. (E) Illustration of DNA demethylation processes.
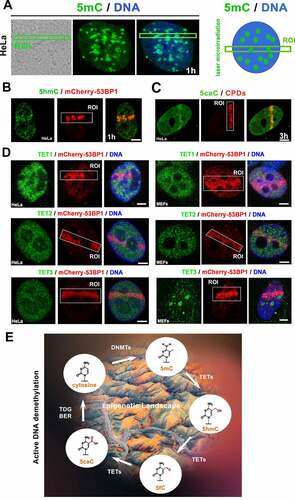
Table 1. Chemical compounds used in DNA repair studies.
Table 2. Specification of donors and acceptors used for FLIM-FRET experiments.
Data Availability statement
https://www.ibp.cz/en/research/departments/molecular-cytology-and-cytometry/research-profile