Figures & data
Table 1. Description of different ranks of Regulomedb.
Figure 1. PRKCE variants data retrieved from different databases (ENSEMBL, COSMIC, EVS, and genomeAD). (A) Total variants obtained for PRKCE gene from all databases were 346, 853. Out of which 376 were UTR variants. b(B) Number of variants belonging to different consequences, retrieved from different databases. c(C) UTR (3’ and 5’) variant number obtained from different databases. Among these 256 and 82 unique 5’ and 3’ UTR variants were sorted, respectively. 5'UTRs are highlighted with green and 3’ UTRs are highlighted with red. d(D) 5'UTR variation frequency and (Ee) heatmap for mutational hotspot. (Ff) 3'UTR variation frequency and (G) heatmap for mutational hotspot.
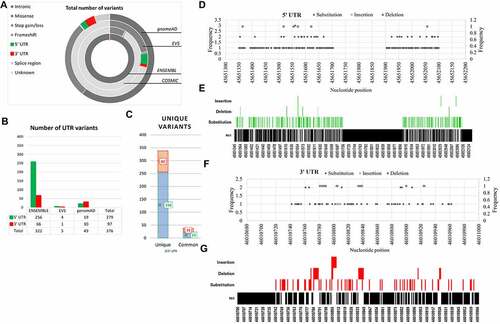
Figure 2. RegulomeDB analysis of 5’ and 3’ UTR variants of PRKCE gene. RegulomeDB probability score of 5 UTR variants (A) and 3'UTR variants (B) of PRKCE. Score near one or one indicates high probability of variant being regulatory variant. (C) Distribution of PRKCE UTR variants in six regulomeDB ranks (2a, 2b, 2c, 3a, 4, and 5). (D) Number of variants in different regulomeDB ranks having probability score more than 0.7.
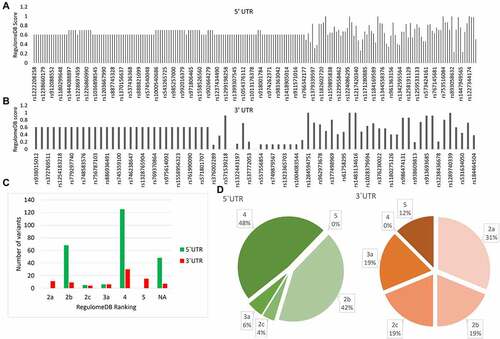
Figure 3. Impact of PRKCE UTR variations on the transcription binding sites of the gene. (A) Most of the PRKCE 5'UTR variants caused the deletion of the transcription factor binding sites and most 3'UTR variants did not have impact on transcription factor binding sites. (B) Graph representing the transcription factor binding sites introduced due to UTR variations. (C) Venn diagram representation of the transcription factor binding site specifically present in Wildtype and mutated sequences and common is both wildtype and mutated PRKCE gene sequence due to 5’ and 3’ UTR variation. (D) Co-regulation mechanism of transcription factors in different tissues in humans. Transcription factors in red box represent sites present at 5'UTR and in green box depicts 3'UTR sites. Number written next to transcription factor complex indicates -LogP value where higher value indicates significance.
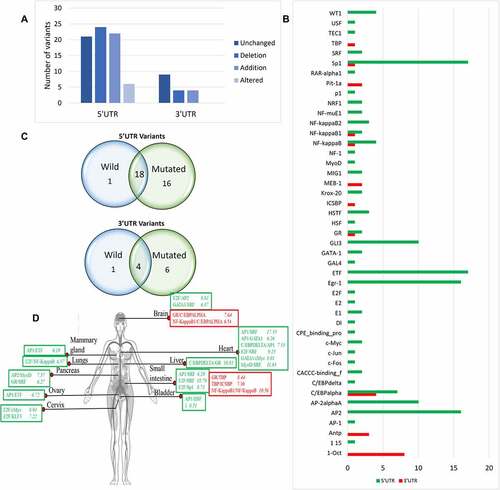
Table 2. Transcription factor binding sites (TFBS) along with the respective transcription factors and the TFBS role in transcription and pathway involve in transcription factor regulation.
Figure 4. KEGG constructed pathway for the regulation of PKCε gene transcription. Cell signalling cascades such as WNT pathway, IL pathway, and EGFR/RAS/RAF pathway contributes to the activation of transcription factors that may bind with the transcription factor binding sites on PRKCE UTRs and regulate its transcription. PKCε also phosphorylates and activates RAF, through which PKCε may drive a positive feedback loop.
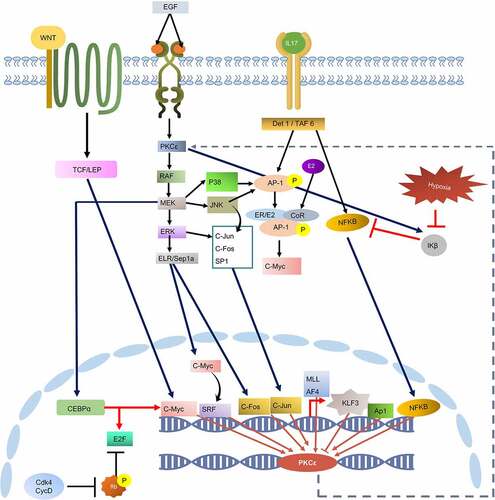
Figure 5. PRKCE UTR variants influence on the mRNA secondary structure. Minimum free energy (MFE) scores for both wildtype sequence and variant sequence for (A) 5'UTR variation and (B) 3'UTR variations are plotted. Lower the MFE score, higher the structure stability. (C) Number of PRKCE UTR variants affecting the mRNA stability. Major number of 5'UTR as well as 3'UTR variants decreased the mRNA structural stability. Variants that increased the mRNA stability are depicted with dotted-red square, whereas variants that decreased stability are highlighted with dotted-green square.
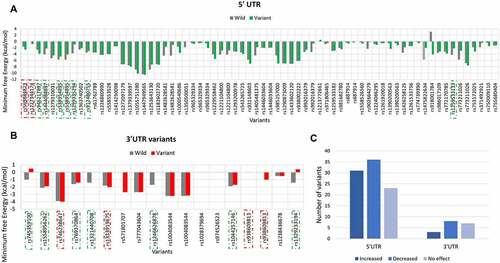
Figure 6. PRKCE mRNA secondary structure prediction and positional entropy alteration due to (A) 5'UTR variations and (B) 3'UTR variation. Positional entropy is depicted in different colours where red depicts lowest entropy and blue represents highest entropy (Red<Orange<Yellow<parrot green<green<cyan<blue). Variants that increased the mRNA stability are depicted with dotted-red square. Further, the variant residue is also highlighted with red box, and the entropy values are also mentioned with red colour.
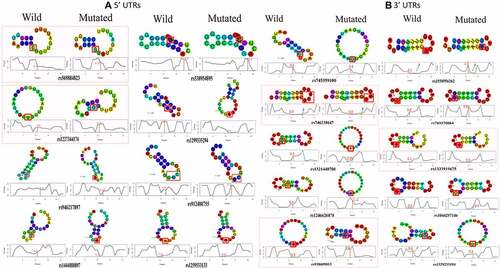
Table 3. List of PRKCE 5’ and 3’ UTR variants impacting the structural stability of PRKCE mRNA.
Figure 7. PRKCE gene interaction with miRNAs modulated by its 5'UTR variations. (A) Minimum free energies (MFE) for each PRKCE variation and miRNA interaction were plotted at the y-axis. Around 30 variants were identified that were clustered in miRNA binding sites and greatly affected the miRNA-mRNA interaction. Black outlined boxes indicate wildtype PRKCE-miRNA MFE, whereas different shades of grey represent variant PRKCE. (B) Heatmap for the sorted PRKCE variants vs miRNAs. Darker or near black colour depict less binding affinity while lighter or near white colour boxes represent high binding affinity. Variants that decreased the PRKCE and miRNA interaction are highlighted with grey box, whereas variants that enhanced their interaction are depicted within grey dotted box.
Table 4. PRKCE 5'UTR variation modulating the 5'UTR interaction with regulatory microRNAs.
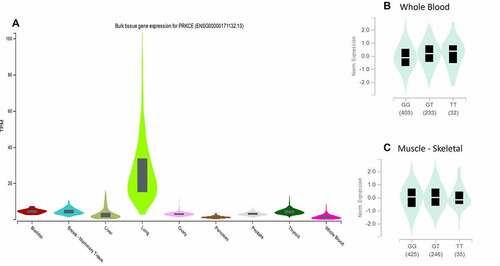
Figure 8. PRKCE gene expression in different tissues. (A) Expression of PRKCE gene is highest in the lungs. (B) Variation rs687014 affects the expression in whole blood ad skeletal muscles.