
Figures & data
Figure 1. VSW-3 RNAP and its promoter. (A) Distance tree analysis of the representative ssRNAPs by the BLAST program. Distance from the root ‘○’: SP6 RNAP (3.374) > T7 RNAP (3.145) > KP34 RNAP (2.572) > VSW-3 RNAP (2.292) > Syn5 RNAP (1.118) suggests that VSW-3 RNAP is the second primitive after Syn5 RNAP and evolved into a new branch of the evolutionary tree together with a predicted PollyC RNAP (3.055) from phage PollyC (YP_009622558.1). (B) SDS-PAGE analysis of purified VSW-3 RNAP (92.4 kDa). (C) Organization of phage VSW-3 genome and distribution of the predicted VSW-3 promoters (indicated by right arrows). (D) IVT of VSW-3 RNAP on the linearized pUC19 plasmid with an insertion of the predicted VSW-3 promoter (top gel). 5’-RACE revealed that the initial nucleotide of VSW-3 RNAP transcription in the predicted promoter was 5’-GTA-3’ (bottom sequencing result). (E) Binding of DNA containing various lengths of putative VSW-3 promoters (17 bp: 5’-TAATTGGGCCACCTATA-3’; 18 bp: 5’-TTAATTGGGCCACCTATA-3’; and 19 bp: 5’-TTTAATTGGGCCACCTATA-3’) by VSW-3 RNAP in IVT buffer at 30°C for 10 min. Binding mixtures were analysed by 12% native TBE–PAGE. The grey values of gel bands were quantified using ImageJ software. Promoter binding percentages were calculated as the molar ratio between bound DNA and total DNA at each enzyme concentration. The binding curve on the right panel was generated by GraphPad Prism. The filled square indicates DNA binding with the 17 bp promoter, the empty triangle indicates DNA binding with the 18 bp promoter, and the empty circle indicates DNA binding with the 19 bp promoter. (F) IVT on 5’-truncated DNA templates (left box) to determine the specific promoter of VSW-3 RNAP. The RNA yield with each template (right gel) suggested that the 15 bp (5’-ATTGGGCCACCTATA-3’) sequence is the minimal promoter, and the 18 bp (5’-TTAATTGGGCCACCTATA-3’) sequence is the full VSW-3 promoter. (G) Comparison of the VSW-3 IVT yield of an sgRNA and its variants with the 5’ first ‘G’ replaced by a ‘C’, a ‘U’, or an ‘A’, respectively, as indicated at the top of the gel.
Figure 2. VSW-3 RNAP IVT conditions. (A) Optimal reaction temperature of the VSW-3 RNAP IVT (25°C) for maximum run-off cas9 RNA yield. (B) Optimal enzyme concentration of the VSW-3 RNAP (0.15 μM) IVT for maximum run-off cas9 RNA yield. (C) Optimal IVT yield of VSW-3 RNAP with various reaction temperature and incubation time combinations. The maximum run-off cas9 RNA yield was obtained at 25°C for 12 h. (D) Gray scale quantification of the run-off RNA transcripts in a gel (C). The diagram was made using GraphPad Prism. (E) Optimal pUC19-RNA yield by VSW-3 RNAP was obtained at 20°C for 16 h, compared to the optimal yield of the same RNA by T7 RNAP at 20°C for 16 h and at 37°C for 1 h, under the same IVT conditions. In all gels, the bands corresponding to DNA templates are indicated by empty stars, and the bands corresponding to run-off RNA transcripts are indicated by filled stars. An arrow indicates terminated transcripts caused by a class I T7 terminator.
Figure 3. Response of ssRNAPs to the class II T7 terminator. (A) Using PCR-amplified templates for cas9 RNA IVT, obvious abortive RNA transcripts were observed for T7 RNAP and Syn5 RNAP but not for VSW-3 RNAP (left gel). 3’-RACE revealed that the T7 RNAP transcription was terminated 9 nt downstream of a class II terminator 5’-ATCTGTT-3’ (bottom sequencing result). (B) Insertion of a class II T7 terminator 5’-ATCTGTT-3’ into the coding sequence of copGFP RNA caused termination of T7 RNAP but not of VSW-3 RNAP. In all gels, the bands corresponding to DNA templates are indicated by empty stars, and the bands corresponding to run-off RNA transcripts are indicated by filled stars. Arrows indicate terminated transcripts caused by class II T7 terminators.
Figure 4. RNA 3’ extension and RdRp activity of T7 and VSW-3 RNAP. (A) Secondary structure of an sgRNA predicted with RNAfold software. (B) IVT synthesis of an sgRNA (targeting eGFP) by VSW-3 and T7 RNAP. (C) 3’-RACE of the sgRNA transcripts from T7 and VSW-3 RNAP IVTs. Only the 3’ region (red sequence on the top) of the full sgRNA in the sequencing results is shown. The length of each sequence is noted. The sequences matching the exact run-off sgRNA (103 nt) are indicated by red stars. (D) Schematic showing the mechanism and origin (3’ self-templated extension by the RdRp activity of T7 RNAP) of the 16 nt 3’-extension in T7 RNAP products as in (C). (E) T7 but not VSW-3 RNAP retained RdRp activity to extend purified sgRNA (with terminal primer-template structure).
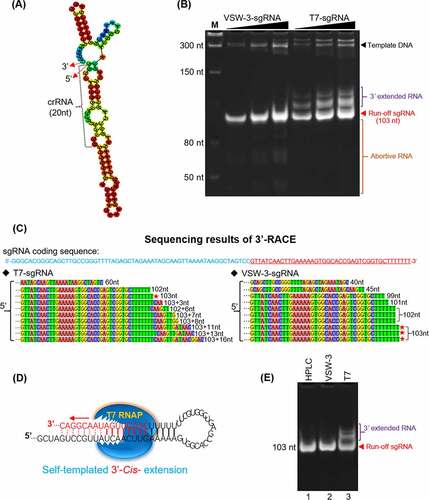
Figure 5. Incorporation of modified nucleotides by WT and Y578F VSW-3 RNAPs. (A) Homologous sequence alignment of VSW-3 RNAP, T7 RNAP, Syn5 RNAP, and KP34 RNAP using Geneious software identified the tyrosine (Y578) in the O-helix region of the VSW-3 RNAP. (B) IVT yield of an sgRNA by WT and Y578F VSW-3 RNAPs was compared. (C) In the IVT system for sgRNA synthesis, the incorporation of modified nucleotides by WT and Y578F VSW-3 RNAP was compared. In each reaction, one of the four NTPs was replaced by its modified analogue (as indicated at the top of the gel). The efficiency of incorporation was judged based on the yield of the run-off sgRNA.
Figure 6. Full-length dsRNA byproducts from T7 and VSW-3 RNAP IVTs. (A) DNA templates for the IVT synthesis of various RNAs, as indicated at the top of the gel. For each RNA, there were two DNA templates differing only in the promoter region to serve for either VSW-3 or T7 RNAP IVTs. DNA concentration and purity were compared using a 1.5% agarose gel stained with ethidium bromide. (B) After template DNA was removed by DNase I treatment and purified using a Monarch RNA Cleanup kit, 1 μg of SOX7, tdTomato, copGFP, and cas9 RNA transcribed by VSW-3 RNAP or T7 RNAP were analysed on a 1.5% agarose gel stained with ethidium bromide. The white and black colours for bands and background were converted in this gel image to make the weaker double-stranded and abortive RNA bands clearer. (C) Dot-blot analysis of the RNA products (each 200 ng) as in (B) by VSW-3 RNAP and T7 RNAP with J2 monoclonal antibody. A prepared dsRNA (351 bp) was applied as a quantitative standard (0.1 ng, 0.25 ng, 0.5 ng, 1.0 ng). (D) Gray value measurement and calculation of the X-ray film image (top image in (C)) by ImageJ software demonstrating the level of dsRNA contamination in T7 and VSW-3 RNAP transcripts. (E) Gel analysis of the VSW-3 (VSW-3) RNA (products of VSW-3 RNAP IVT with the purified VSW-3-copGFP RNA as the template), T7-copGFP RNA, T7 (VSW-3) RNA (products of T7 RNAP IVT with the purified VSW-3-copGFP RNA as the template), and annealed copGFP dsRNA (black arrow), with no additional band corresponding to dsRNA observed for VSW-3 (VSW-3) RNA and T7 (VSW-3) RNA. (F) Dot-blot analysis of VSW-3 (VSW-3) RNA and T7 (VSW-3) RNA showed that no dsRNA product signal was detected, confirming that full-length dsRNA products did not originate from RNA-templated RdRp activity.
Figure 7. Comparison of the sgRNA (A) and copGFP RNA (B) synthesis by T7 or VSW-3 RNAP under the same IVT conditions (25°C for 12 h). The right panel in (B) shows the J2 antibody dot-blot detection of dsRNA (as in ) in the copGFP RNA products from the VSW-3 or T7 IVT. The terminal (A) and full-length dsRNA (B) by T7 RNAP were not reduced by lowering the IVT temperature.
Supplemental Material
Download PDF (4.6 MB)Data availability statement
The datasets generated during the current study are available from the corresponding author on reasonable request. Supplementary Data are available online.