Figures & data
Figure 1. Genome-wide identification of lncRNAs across 26 plant species. (A) The phylogenetic tree of the 26 selected plant species, including six non-flowering plant species: Cucumis sativus (Csa), Citrullus lanatus (Cla), Solanum lycopersicum (Sly), Vitis vinifera (Vvi), Cicer arietinum (Car), Glycine max (Gma), Fragaria vesca (Fve), Arabidopsis thaliana (Ara), Arabidopsis lyrata (Aly), Capsella rubella (Cru), Arabis alpine (Aal), Brassica oleracea (Bol), Brassica napus (Bna), Brassica rapa (Bra), Brassica juncea (Bju), Tarenaya hassleriana (Tha), Nelumbo nucifera (Slo), Oryza sativa (Osa), Zea mays (Zma), Amborella trichopoda (Atr), Azolla filiculoides (Afi), Selaginella moellendorffii (Smo), Marchantia polymorpha (Mpo), Physcomitrella patens (Ppa), Chlamydomonas reinhardtii (Cre) and Volvox carteri (Vca). (B) The number of lincRNAs identified in each plant species. (C) The distribution of exon number of lincRNAs in each plant species. (D) The distribution of lincRNA isoform numbers in each plant species. (E) The maximum expression level of both lincRNAs and protein-coding genes (PCGs) in each plant species. (F) The genomic length of both lincRNAs and protein-coding genes (PCGs) in each plant species. (G) Correlation between genome size and the number of identified lincRNAs per sample.
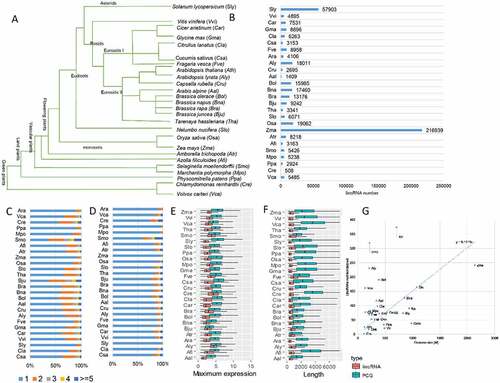
Figure 2. Conservation of lincRNAs by sequence similarity in plants. (A) Three types of lincRNA families based on sequence similarity: one2one family, one2many family and many2many family. The corresponding family number and percentage of each type are shown on the right of the graph. (B) The percentage of each type of lincRNA family in each plant species. (C) The percentage of homologous lincRNAs in each plant species. (D) The distribution of the number of lincRNA families shared within 2–25 species. Inset: The distribution of the number of Arabidopsis thaliana lincRNAs shared in 2–25 other species. (E) The number of conserved lncRNAs across different levels of evolutionary lineages in plants, including Plants, Angiosperms, Monocots, Eudicots and Brassicaceae (see M&M for definition).
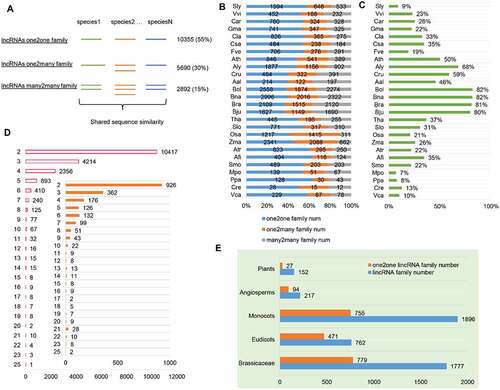
Figure 3. Active regulation of ancient lincRNAs in plants. (A) Sequence conservation (PhastCons Score) of the lincRNAs among the 20 flowering plants at four levels of evolutionary age (Plants, n = 71; Angiosperms, n = 11; Eudicots, n = 65; Brassicaceae, n = 556). Protein-coding genes (PCGs) (Gene, n = 27,655) were used as control. (B) SNP frequency (SNPs/100-bp) in lincRNAs from different evolutionary age classes (Plants, n = 71; Angiosperms, n = 11; Eudicots, n = 65; Brassicaceae, n = 556). PCGs (Gene, n = 27,655) were used as control. (C) Sequence conservation (PhastCons Score) of the old and young lincRNAs from the 20 flowering plant species. Old lincRNAs (n = 148): lincRNAs of the evolutionary age classes of Plants, Angiosperms and Eudicots; young lincRNAs (n = 566): lincRNAs of the evolutionary age classes of Brassicaceae. PCGs (Gene, n = 27,655) were used as control. (D) The expression level of the old and young lincRNAs. (E) Tissue specificity index of the old and young lincRNAs. (F) Frequency of histone modification (H3K9me2, H2A.W.6, H3K27me1 and H3K27ac) in 1-kb upstream/downstream regions of the old lincRNAs, young lincRNAs and PCGs. (G) Frequency of binding sites for transcriptional factors (SVP, FLC, AP1, AP2, AP3, BPC, SEP3 and FIE) in 1-kb upstream/downstream regions of the old lincRNAs, young lincRNAs and PCGs.
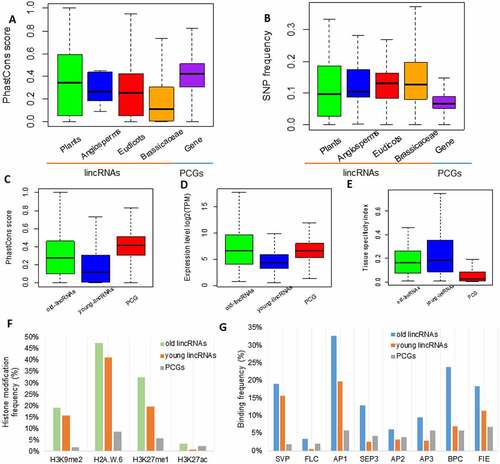
Figure 4. The rapid transcriptional turnover of lincRNAs during the evolution of Arabidopsis thaliana, Arabidopsis lyrata and Capsella rubella. (A) Percentage of A. thaliana lincRNAs and protein-coding genes transcribed in other 25 plant genomes, including the six non-flowering plants. (B) Hierarchical clustering of pairwise correlations of the lincRNA families in A. thaliana, A. lyrata and C. rubella. AT_: tissues of A. thaliana; AL_: tissues of A. lyrata; CR_: tissues of C. rubella. (C) The proportion of lincRNAs sharing flower expression specificity in A. thaliana, A. lyrata and C. rubella. (D) The expression level of AtklncRNA1946 in different tissues of A. thaliana, A. lyrata and C. rubella.
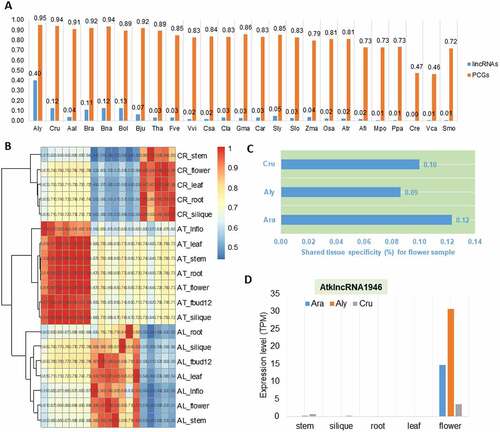
Figure 5. The rapid transcriptional turnover of lincRNAs during the evolution of Oryza sativa and Zea mays. (A) Hierarchical clustering of pairwise correlations of lincRNA families in O. sativa and Z. mays. Os_: tissues of O. sativa; Zm_: tissues of Z. mays. (B) The proportion of lincRNAs sharing flower expression specificity in O. sativa and Z. mays. MZ: root meristematic zone; EZ: root elongation zone; DZ: root differentiation zone. (C) Conserved expression of Osalnc.47386 and Zmalnc.236427 in O. sativa and Z. mays. (D) Hierarchical clustering of pairwise correlations of lincRNA families during the evolution of O. sativa and Z. mays. Os_: tissues of O. sativa; Zm_: tissues of Z. mays. (E) The expression level of Zmalnc.293022 in different tissues of Z. mays. (F) The expression level of Osalnc.21528 in different tissues of O. sativa. (E) and (F) show the conserved expression of the homologous pair lincRNAs in SAM.
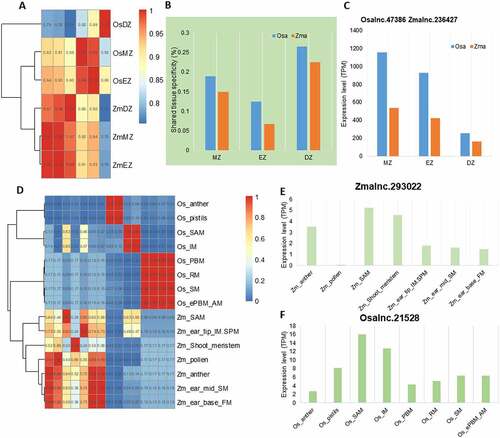
Figure 6. Conservation of lincRNAs in Brassicaceae family. (A) Number of Arabidopsis thaliana lincRNAs with different levels of homologous (sequence only, sequence&synteny and synteny only) in other species. Inset: a diagram showing syntenic homologous lincRNAs. (B) Distribution of the 199 A. thaliana lincRNAs with sequence&synteny homologs in other eight plant species. Most A. thaliana lincRNAs have homologs in the Brassicaceae family, especially in the closely related A. lyrate, and just few in Csa and Sly (not showing in the pie graph). (C) Conservation of the 199 A. thaliana sequence&synteny lncRNAs. Each horizontal bar represents a homologous lincRNA in the corresponding species shown on the X-axis. (D) Syntenic relationship between Aralnc.24900 and its homologs on other plant species. (E) Sequence alignment of A. thaliana Aralnc.24900 and its homologs from Arabis alpine (Aallnc.21915), Capsella rubella (Crulnc.26039) and Brassica napus (Bnalnc.90570).
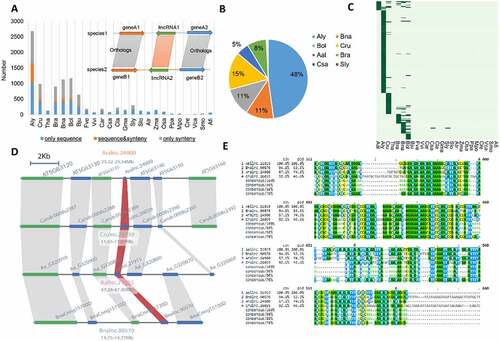
Figure 7. The functionality of Aralnc.24900 and its homologs based on co-expression analysis. (A) Characteristics of Aralnc.24900 and its homologs in Ban and Cru as well as the transcription factors interacting with Aralnc.24900. (B) GO annotation of the genes co-expressed with Aralnc.24900 in Ara.Module36 in Arabidopsis thaliana. (C) GO annotation of the genes co-expressed with Crulnc.26039 in the module of Cru.Module31 in Capsella rubella. (D) GO annotation of the genes co-expressed with Bnalnc.90570 in the module of Bna.Module116 in Brassica napus. (E) The expression pattern of Aralnc.24900 in different tissues of A. thaliana. (F) The enrichment of transcription factors (AP1, SEP3, LFY, and FUL) interacting with Aralnc.24900 in different flower-related co-expression modules. (G) The coverage map showing Aralnc.24900 bound by LFY, AP1 and SEP3 TFs in A. thaliana. 20way.plants.bw: the track of PhastCons scores.
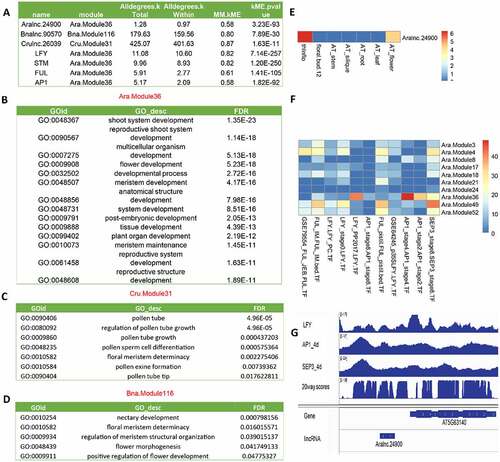
Figure 8. Conservation of lincRNAs in the grass family. (A) GO annotation of the genes co-expressed with Osalnc.36529 in the flower-related Osa.module81. (B) GO annotation of the genes co-expressed with Zmalnc.77640 in the flower-related Zma.module3. (C) The syntenic relationship between Osalnc.36529 and Zmalnc.77640. (D) The expression pattern of Osalnc.36529 in different tissues of Oryza sativa. (E) The expression pattern of Zmalnc.77640 in different tissues of Zea mays.
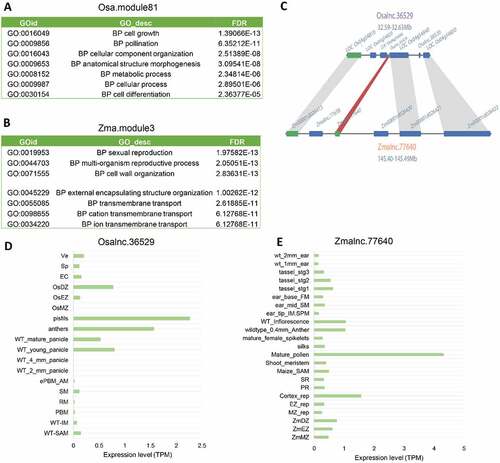
Figure 9. Transposable elements (TEs) drive the evolutionary origins of lincRNAs. (A) Fraction of lincRNAs and protein-coding genes overlapping with TEs. (B)Top three TE types in terms of percentage of lincRNAs overlapping with TEs in different plant species. (C) The percentage of Arabidopsis thaliana lincRNAs overlapping with TEs in different evolutionary age groups (in decreasing order; Plants: n = 71; Angiosperms: n = 11; Monocots_Eudicots: n = 242; Eudicots: n = 65; Asterids_Rosids: n = 135; Brassicaceae: n = 556; Ara-specific: n = 2044). (D) The percentage of Oryza sativa lincRNAs overlapping with TEs in different evolutionary age groups (in decreasing order; Plants: n = 262; Angiosperms: n = 111; Monocots_Eudicots: n = 1023; Monocots: n = 2482; Osa-specific: n = 15,073). (E) Comparison of the conserved and non-conserved lincRNAs overlapping with TEs in A. thaliana (Ath), A. lyrata (Aly) and Capsella rubella (Cru). (F) Percentage of the conserved and non-conserved lincRNAs overlapping with TEs in O. sativa and Zea mays. (G) Schematic representation of the overlapping between lincRNAs and TEs in A. thaliana (Ath), A. lyrata (Aly) and C. rubella (Cru). Green bars represent lincRNAs, and black bars are TEs.
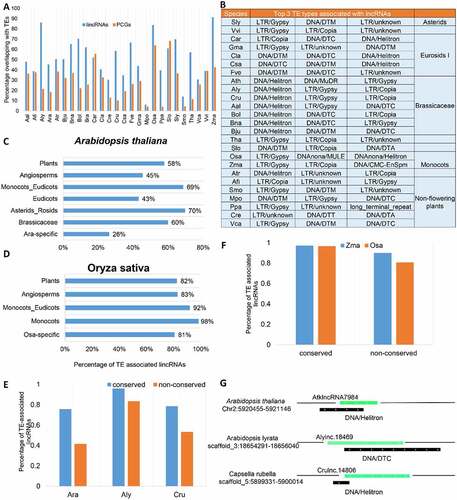
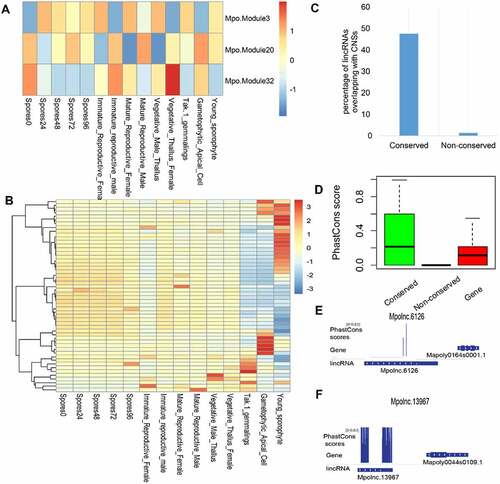
Figure 10. LincRNAs in the land plant Marchantia polymorpha. (A) Expression pattern (eigen genes in each module) of meristem-related modules in different tissues of Marchantia polymorpha. The co-expression modules involving protein-coding genes (PCGs) and lincRNAs in the land plant Marchantia polymorpha was generated by WGCNA. (B) The expression pattern of the lincRNAs conserved in the three meristem-related modules (Mpo.Module3, 30, 32) across different tissues. (C) Conserved lincRNAs in Marchantia polymorpha are enriched in conserved non-coding sequences (CNSs). (D) Sequence conservation (PhastCons Score based on 26 plant genomes) of conserved lincRNAs, non-conserved lincRNAs and PCGs in Marchantia polymorpha. (E) PhastCons Score of Mpolnc.6126 (in Mpo.Module32). (E) PhastCons Score of the Mpolnc.13967 (in Mpo.Module3).