
Figures & data
Figure 1. Screening of inhibitors for perturbing nuclear poly(A)+ RNA metabolism.
(A) Screening of inhibitors that affect nuclear poly(A)+ RNA metabolism. RNA-FISH was performed to determine the localization of bulk poly(A)+ RNA. U2OS cells were treated with 2 µM of each compound for 24 h. GEX1A (30 ng/mL) was used as a positive control. Bulk poly(A)+ RNA was visualized with Alexa Fluor 594-labelled oligo-dT45 probe. The nuclei were visualized with DAPI. Scale bar, 50 μm. (B) The ratio of the nuclear distribution of poly(A)+ RNA was analyzed. Signal intensities of the whole cell and the nucleus were quantified using ImageJ (n = 40). Boxes indicate median (centerline) and upper and lower quartiles. Whiskers indicate the lowest and highest values. Statistical analysis was performed using one-way analysis of variance (ANOVA) followed by Dunnett’s test. ***p < 0.001. Dau: daunorubicin, Dox: doxorubicin, Acla: aclarubicin, Ama: α-amanitin, Cam: camptothecin, Anti: antimycin (C) Localization of bulk poly(A)+ RNA and nuclear speckles. Poly(A)+ RNA (red), speckle (green), and chromosomal DNA (blue) were visualized in U2OS cells. The cells were treated with each inhibitor for 24 h. Scale bar, 10 μm. Signal intensities on the white line for poly(A)+ RNA and speckle are plotted and presented with red and green lines in the right panel, respectively.
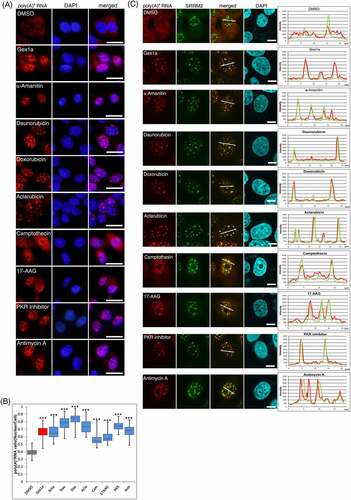
Figure 2. De novo pyrimidine synthesis pathway perturbs poly(A)+ RNA metabolism.
(A) Schematic of mitochondrial respiratory-chain complexes and DHODH. CI–V: mitochondrial complex I–V, CoQ: CoenzymeQ, CytC: cytochrome c, DHO: dihydroorotic acid, ORO: orotic acid, UMP: uridine monophosphate, (B) Representative localization of poly(A)+ RNA in MCF7 cells treated with rotenone (0.5 µM), antimycin A (0.25 µM), and NaN3 (1 µM) for 36 h. The nuclei were visualized with DAPI. Scale bar, 50 μm. (C) The ratio of the nuclear distribution of poly(A)+ RNA was analyzed. Signal intensities of the whole cell and the nucleus were quantified using ImageJ (n = 40). Boxes indicate median (centerline) as well as upper and lower quartiles. Whiskers indicate the lowest and highest values. Statistical analysis was performed using one-way ANOVA followed by Dunnett’s test. ***p < 0.001. (D) The localization of bulk poly(A)+ RNA and nuclear speckles. Poly(A)+ RNA (red), speckles (green), and chromosomal DNA (blue) were visualized for colocalization analysis in MCF7 cells. The cells were treated with DMSO or brequinar (0.5µM) for 36 h. Scale bar, 10 μm. Signal intensities on the white line are plotted in the right panels. Poly(A)+ RNA and speckle signals are shown with red and green lines, respectively. (E) RNA-FISH was performed to determine the localization of bulk poly(A)+ RNA. MCF7 cells were treated with DMSO, antimycin A (0.25 µM), or brequinar (0.5 µM), with or without uridine 2 mM for 36 h. The bulk poly(A)+ RNA was visualized with Alexa Fluor 594-labelled oligo-dT45 probe. The nuclei were visualized with DAPI. Scale bar, 50 μm. Rote: rotenone, Anti: antimycin A, Bre: brequinar (F) The ratio of the nuclear distribution of poly(A)+ RNA was analyzed. Signal intensities of the whole cell and the nucleus were quantified using ImageJ (n = 40). Boxes show median (centerline) as well as upper and lower quartiles. Whiskers show the lowest and highest values. Statistical analysis was performed using one-way ANOVA followed by Tukey’s test. ***p < 0.001. Rote: rotenone, Anti: antimycin A, Bre: brequinar
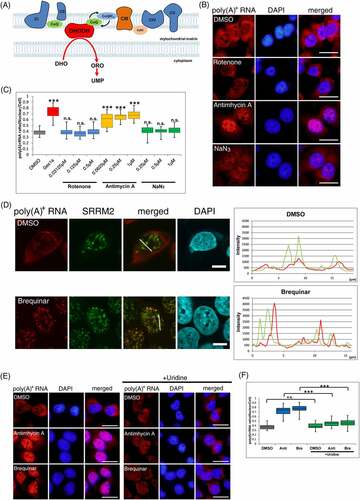
Figure 3. ATM activation is required to elicit nuclear accumulation of poly(A)+ RNA by inhibitors of the respiratory chain complex III and DHODH.
(A) RNA-FISH was performed to determine the localization of bulk poly(A)+ RNA. MCF7 cells were treated with DMSO, antimycin A (0.25 µM), or brequinar (0.5 µM) with or without CP466722 (20 µM) for 36 h. The bulk poly(A)+ RNA was visualized by Alexa Fluor 594-labelled oligo-dT45 probe. The nuclei were visualized with DAPI. Scale bar, 50 μm. (B) The ratio of the nuclear distribution of poly(A)+ RNA was analyzed. Signal intensities of the whole cell and the nucleus were quantified using ImageJ (n = 40). Boxes indicate median (centerline) as well as upper and lower quartiles. Whiskers indicate the lowest and highest values. Statistical analysis was performed using one-way ANOVA followed by Tukey’s test. ***p < 0.001. (C) Protein expression of ATM, p-ATM, Chk2, and p-Chk2 were examined by immunoblotting. Actin was used as a loading control. Anti: antimycin A, Bre: brequinar
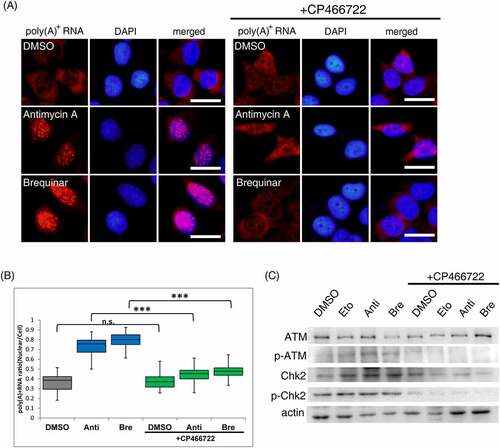
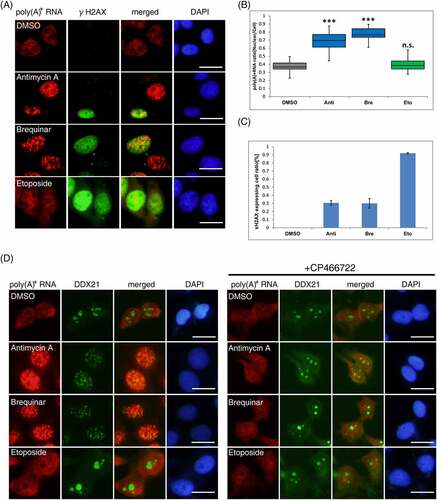
Figure 4. Relocalization of the nucleolar component by DHODH inhibition.
(A) The localization of bulk poly(A)+ RNA and ɤH2AX. Poly(A)+ RNA (red), ɤH2AX (green), and chromosomal DNA (blue) were visualized in MCF7 cells. Cells were treated with DMSO, antimycin A (0.25 µM), brequinar (0.5 µM), or etoposide (5 µM) for 36 h. Scale bar, 50 μm. (B) The ratio of the nuclear distribution of poly(A)+ RNA was analyzed. The signal intensities of the whole cell and the nucleus were quantified using ImageJ (n = 40). Boxes show median (centerline) as well as upper and lower quartiles. Whiskers show the lowest and highest values. Statistical analysis was performed using one-way ANOVA followed by Dunnett’s test. ***p < 0.001. (C) The ratio of the ɤH2AX-expressing cells was counted (n = 300). Each value is the mean ± SD of three independent experiments. (D) The localization of bulk poly(A)+ RNA and DDX21. Poly(A)+ RNA (red), DDX21 (green), and chromosomal DNA (blue) were visualized in MCF7 cells. Cells were treated with DMSO, antimycin A (0.25 µM), brequinar (0.5 µM), or etoposide (5 µM) with or without CP466722 (20 µM) for 36 h. The bulk poly(A)+ RNA was visualized by Alexa Fluor 594-labelled oligo-dT45 probe. The nuclei were visualized with DAPI. Scale bar, 50 μm. Anti: antimycin A, Bre: brequinar, Eto: etoposide
Supplemental material