Figures & data
Figure 1. Interference mediated by the S. epidermidis Cas10-Csm complex. (A) The type III-A CRISPR-Cas locus in S. epidermidis contains a repeat-spacer region with three spacers (coloured) and four repeats (grey) and nine CRISPR-associated genes. The repeat-spacer is transcribed and processed during crRNA biogenesis into mature crRNA of primarily 37 and 43 nucleotides. The crRNA combine with five Cas proteins to form the Cas10-Csm effector complex which carries out interference against foreign genetic elements. An active site in the Csm3 protein cuts bound target RNA (black triangles) and Csm6, once stimulated by cyclic oligoadenylates (cOAs) indiscriminately cuts RNA inducing cell dormancy. Cas10 also possesses a ssDNA cutting activity that is not pictured. (B) The 8 nucleotides on the 5’ end of crRNA are referred to as the 5’ tag or the proto-spacer flanking sequence (PFS) and are not involved in base-pairing to cognate targets. The first nucleotide following the 5’ tag can engage in base-pairing to a cognate target and is numbered +1. Each six nucleotides of crRNA behaves as a structural unit with five nucleotides base-pairing and the sixth unpaired. This pattern repeats throughout the crRNA–target duplex and each six-nucleotide segment can be assigned a number 1–5.
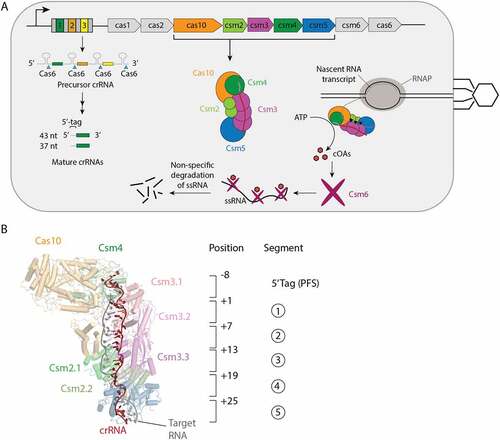
Figure 2. Identification of crRNAs bound to Cas10-Csm by mass spectrometry. (A) Cas10-CsmCsm3 D32A, a variant of the complex that is without Csm3 catalysed target RNase activity, co-purifies from S. epidermidis cells bound to crRNAs derived from three spacers with lengths of predominantly 37 and 43 nucleotides. The 5’ tag region of crRNA has a constant sequence derived from the repeat regions that flank spacers in the genome. Spacer regions in the CRISPR-Cas loci encode for unique crRNAs of variable sequence. (B) 32P-labelled, extracted crRNAs were visualized on a urea-PAGE gel revealing a distribution of intermediate and mature species with the 37 and 43 nts being most prominent. The 43-mer crRNA band, for which mass spectrometry data is shown, is highlighted with a red box. (C) MALDI mass spectrometry performed on the mixture of crRNAs identifies distinct peaks associated with the unique sequence of each RNA.
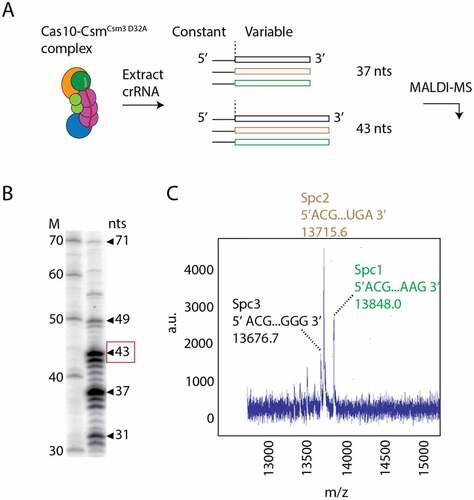
Figure 3. A triple mismatch in segment 1 of the crRNA–target duplex inhibits cOA synthesis. (A) cOA synthesis was assayed by incubating either cognate target–RNAs or RNAs containing mismatches at positions +1, +2 and +3 with Cas10-Csm complex and α-32P-ATP. Radiolabeled cOA products were separated on a TLC plate and visualized by phosphorimaging. (B) A serial dilution of known amounts of 32P-ATP was applied to a TLC plate and quantitated to establish the dynamic range of the assay. (C) An image of cOA synthesis reactions, performed in triplicate, in the presence of cognate (Cog.) target–RNA or triple mismatch target–RNA. Data are shown for target RNAs complementary to the spacer-1 crRNA (Nes) and the spacer-2 crRNA (Cn20). The lower image shown is the same TLC plate overexposed. (D) Reactions shown in (C) were quantified using ImageJ and interpolated using the curve in (B) to moles of product generated. ***P <0.001.
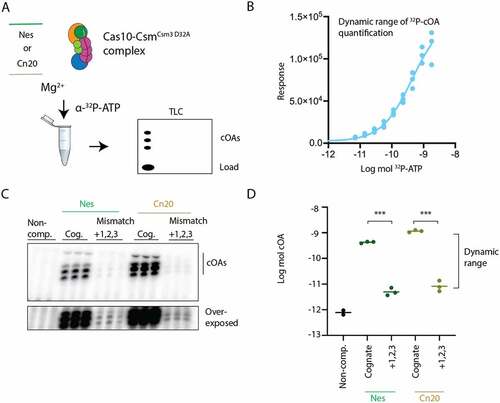
Figure 4. Single mismatches in the crRNA–target duplex inhibit cOA synthesis in a position- dependent and sequence-dependent manner. (A) Triplicate cOA synthesis reactions were performed with Nes target RNAs containing a single mismatch at position +1 to position +30 in the presence of α-32P-ATP and the cOA products were resolved by TLC and quantitated by phosphorimaging. Targets which produce cOA levels significantly different than cognate target RNA are shown in red. Mismatches at +2 or +7 or reactions conducted without any target were below the level of detection (<LoD). Mismatches significantly different than cognate have the identity of the mismatch given (for example A • A indicates two adenosines mismatched with each other). (B) Triplicate cOA synthesis reactions with Cn20 target RNAs containing single mismatches from position +1 to position +30. As above, targets which produce cOA levels significantly different than cognate target RNA are shown in red. *P < 0.05.
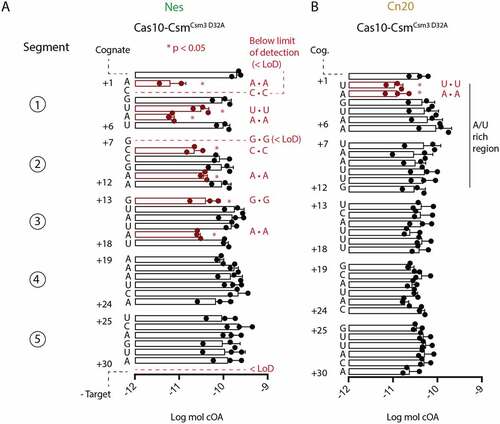
Figure 5. Single and triple mismatch target–RNAs show only modest changes in binding affinity towards Cas10-CsmCsm3 D32A compared to cognate targets. (A) 32P-labelled Nes targets were incubated with increasing amounts of Cas10-Csm and bound target was isolated with a nitrocellulose and Hybond double membrane assay. Fraction bound was found by quantitating the amount of 32P-target on the nitrocellulose membrane (Cas10-Csm bound) versus the total amount of target (nitrocellulose plus Hybond) by phosphorimaging. (B) An affinity binding assay was also performed with 32P-labelled Cn20 targets.
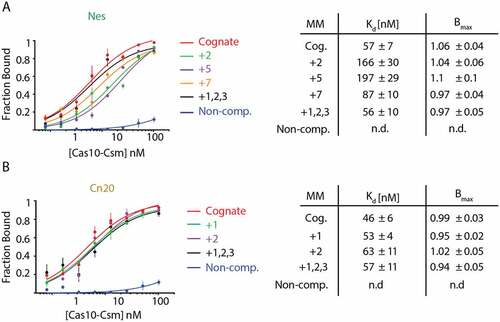
Figure 6. Schematic of the cOA-mediated interference assay. E. coli cells harbouring pACYC-crispr spc1 or pACYC-crispr spc2 are electroporated with the corresponding pTarget and transformation efficiency (colony-forming units per mL) is scored as a measure of interference. Cells transformed with pTarget have a chloramphenicol-resistant (CamR) and ampicillin-resistant (AmpR) phenotype. The pACYC-crispr plasmids are labelled as wt because each encodes a catalytically active Csm3 rather than the D32A target RNase-dead variant used for in vitro assays.
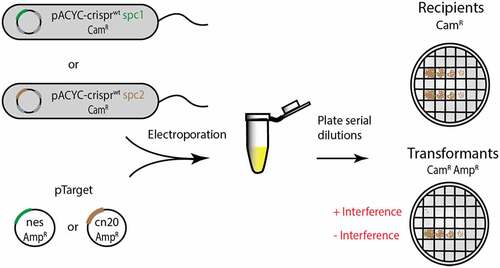
Figure 7. The effect of crRNA–target mismatches on cOA-mediated interference in cells. (A) A schematic of the base-pairing between crRNA and target RNAs encoded in the assay. Mismatching segments were successively introduced into the target gene beginning with segment 1. The effect of mismatched segments on interference was measured by the transformation efficiency of mismatched versions of pTarget harbouring a fragment of the nes gene. Recipient colony-forming units (CFUs) indicate the number of cells available for transformation and the transformants CFUs indicate pTarget uptake. (B) The same assay was performed but now pACYC-crisprwt carried the spc2 gene which encodes a crRNA targeting the transcript of the cn20 gene, a fragment of which is encoded on pTarget cn20. (C) A schematic of pTarget constructs used in a second interference assay is shown that introduced successive mismatches beginning with segment 5. The assay was performed with pTarget encoding nes and (D) pTarget encoding cn20.
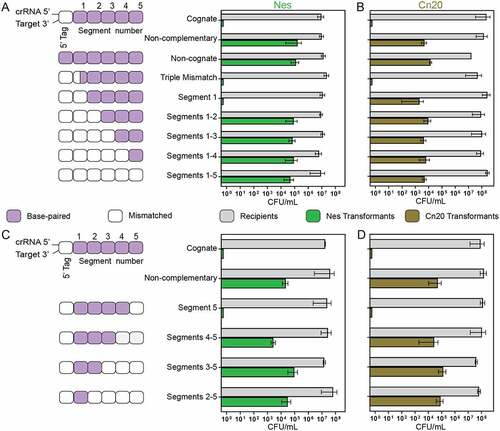
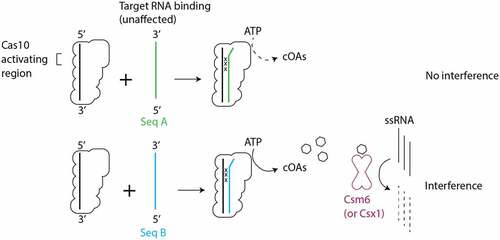
Figure 8. Intrinsic features of the sequence of target RNAs determine the effect of mismatches on cOA-mediated interference. Mismatches between crRNA and target RNA in the Cas10-activating region did not lead to substantial defects in target binding. However, cOA synthesis is sensitive to crRNA–target mismatches in the Cas10-activating region in a manner that depends on intrinsic features of the target sequence. Seq A and Seq B indicate two hypothetical target RNA sequences which differ in their ability to stimulate cOA synthesis. The ‘x’ symbol indicates a crRNA–target RNA mismatch.