
Figures & data
Figure 1. Mouse Adipoq 5’-UTR harbours a translational inhibitor element. (A) CMV-driven plasmids containing polyadenylated FLuc vector with 5’-UTR, 3’-UTR, or 5’− and 3’-UTRs (right) of AdipoQ were transfected into 3T3-L1 adipocytes. FLuc activity was normalized to expression of co-transfected RLuc (left; mean ± SEM, n = 3, **P < 0.01). (B) plasmids containing 25-nt deletions of 5’-UTR (left-top) were transfected into adipocytes. FLuc activity was normalized by expression of co-transfected RLuc (left-bottom; mean ± SEM, n = 3, *P < 0.05). Secondary structure of Adipoq 5’-UTR was determined by mfold (right). Deletions (solid and dashed curves), mutations (individual labels), and start codons (shaded boxes) are highlighted. (C) plasmids containing mutations that disrupt or restore secondary structure of Adipoq 5’-UTR were used to in vitro synthesize RNA. in vitro translation was done using RRL, and luciferase activity normalized to vector control (mean ± SEM, n = 3: ns, not significant).
Figure 2. Mouse adiponectin expression is inhibited by uORF element in the 5’-leader. (A) adiponectin is encoded on 3 exons. 5’-UTR (leader) sequence in exons 1 and 2 is shown above, sequence of exon 1 with the uORF ATGs (bold) are shown below. (B) an RLuc reporter with 5’-leader bearing A-to-G mutations in both uORF sites was generated; the vertical shift in the schematic indicates the altered reading frame (top). The mutated and control constructs were subjected to in vitro translation in a RRL, and luciferase activity determined (bottom; mean ± SEM, n = 3, **P < 0.01). (C) reporter fusion constructs were engineered with (AUGApN) without (ΔAUGG) the AUG of adiponectin (ApN), and with a single following ‘G’ to restore RLuc ORF in the same reading frame as the uOrfs. A triplet in RLuc that acts as a stop codon in the uORF reading frame is indicated (*) (schematic at top). RLuc immunoblot following translation by RRL (middle) and Ponceau stain (bottom). (D) effect of Adipoq uORF peptide on translation of luciferase mRNA in RRL (mean ± SEM, n = 3, ns, not significant). (E) effect of translation of uORF region as a fusion protein of reporter (ΔATGG) has a stimulatory influence on translation (mean ± SEM, n = 3, *P < 0.01). (F) published ribosome profiling data [Citation47] (available on-line at GSE89108 | GEO | 2017/08/04) show elongating ribosomes on the AdipoQ transcript from 0-day (top) and 5-day (middle) differentiating primary mouse adipocyte cultures, and mouse adipose tissue (bottom). The data was visualized using UCSC genome browser.
![Figure 2. Mouse adiponectin expression is inhibited by uORF element in the 5’-leader. (A) adiponectin is encoded on 3 exons. 5’-UTR (leader) sequence in exons 1 and 2 is shown above, sequence of exon 1 with the uORF ATGs (bold) are shown below. (B) an RLuc reporter with 5’-leader bearing A-to-G mutations in both uORF sites was generated; the vertical shift in the schematic indicates the altered reading frame (top). The mutated and control constructs were subjected to in vitro translation in a RRL, and luciferase activity determined (bottom; mean ± SEM, n = 3, **P < 0.01). (C) reporter fusion constructs were engineered with (AUGApN) without (ΔAUGG) the AUG of adiponectin (ApN), and with a single following ‘G’ to restore RLuc ORF in the same reading frame as the uOrfs. A triplet in RLuc that acts as a stop codon in the uORF reading frame is indicated (*) (schematic at top). RLuc immunoblot following translation by RRL (middle) and Ponceau stain (bottom). (D) effect of Adipoq uORF peptide on translation of luciferase mRNA in RRL (mean ± SEM, n = 3, ns, not significant). (E) effect of translation of uORF region as a fusion protein of reporter (ΔATGG) has a stimulatory influence on translation (mean ± SEM, n = 3, *P < 0.01). (F) published ribosome profiling data [Citation47] (available on-line at GSE89108 | GEO | 2017/08/04) show elongating ribosomes on the AdipoQ transcript from 0-day (top) and 5-day (middle) differentiating primary mouse adipocyte cultures, and mouse adipose tissue (bottom). The data was visualized using UCSC genome browser.](/cms/asset/1a08666f-563a-409e-8a78-c89e67c1a63c/krnb_a_2256094_f0002_b.gif)
Figure 3. Adiponectin is a positive responder to eIf2α phosphorylation and the ISR. (A) HEK293T cells were transfected with control (left) or 5’-leader-containing (centre) reporter, and treated with thapsigargin (TG) for 6 h, and luciferase activity determined (mean ± SEM, n = 3, **P < 0.01). Immunoblot analysis of 5’-leader-containing reporter (right). (B) polysome fractionation of control or TG-treated HEK293T cells; 80S and polysome peaks are indicated (left 2 panels). Relative rates of total protein synthesis were determined by quantification of areas under the curves for 80S and polysome peaks using NIH imageJ (right; mean ± SEM, n = 3, *P < 0.01). (C) Adipoq-5’-leader-RLuc and gapdh mRnas in polysomal and non-polysomal fractions were determined by RT-qPCR using TaqMan probes (mean ± SEM, n = 3, **P < 0.001, **P < 0.01). (D) immunoblot analysis of P-Ser51-eIF2α in wild-type (S/S) and phospho-deficient MEFs (A/A) treated with TG (left). (E) RLuc activity of S/S and A/A MEFs transfected with 5’-leader construct and treated with TG (mean ± SEM, n = 4, **P < 0.001). (F) differentiated 3T3-L1 adipocytes were treated with TG for 3 h, and adiponectin in the cell lysate and conditioned medium (CM), as well as eIf2a and P-Ser51-eIF2α, determined by immunoblot (left). Adiponectin in each fraction was quantitated by densitometry and corrected for aliquot size (centre). Adipoq mRNA was determined by RT-qPCR (right). (mean ± SEM, n = 3, **P < 0.05, ***P < 0.001, ns = non-significant). (G) translation rate of Adipoq mRNA was investigated by polysome fractionation of lysates from differentiated 3T3-L1 adipocytes subjected to control condition or treated with TG (top 2 panels). Adipoq and gapdh mRnas in polysomal and 80S monosomal fractions were determined by RT-qPCR using TaqMan probes (bottom; mean ± SEM, n = 3, **P < 0.0001).
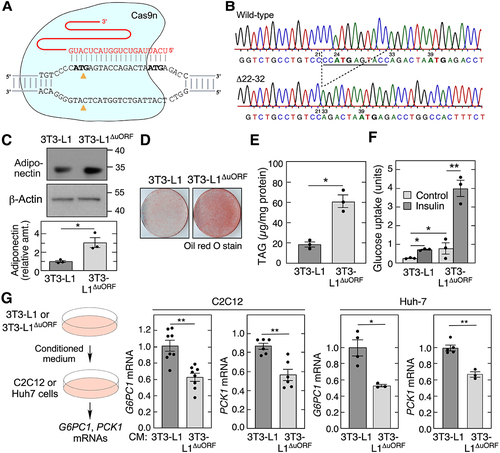
Figure 4. Deletion of AdipoQ uORF increases adiponectin levels and insulin sensitivity. (A) schematic of region targeted by guide RNA. (B) Sanger sequencing of the 3T3-L1ΔORF exon 1 region of Adipoq. (C) immunoblot analysis of conditioned media from differentiated 3T3-L1 and 3T3-L1ΔORF adipocytes (left). Densitometric quantitation of adiponectin in conditioned media (right; mean ± SEM, n = 3, **P < 0.05). (D) Oil Red O staining of differentiated 3T3-L1 and 3T3-L1ΔORF adipocytes. (E) TAG accumulation in 3T3-L1 and 3T3-L1ΔORF adipocytes was determined after differentiation using enzymatic method (mean ± SEM, n = 3, *P < 0.05). (F) glucose uptake in untreated and insulin-treated 3T3-L1 and 3T3-L1ΔORF adipocytes (mean ± SEM, n = 3, **P < 0.05, **P < 0.01). (G) medium conditioned by 3T3-L1 and 3T3-L1ΔORF adipocytes for 24 h was incubated with C2C12 cells for 24 h, and G6PC1 and PCK1 mRNA determined by qRT-PCR (2nd and 3rd panels, mean ± SEM, n = 6 to 8, **P < 0.01). Similar experiment was repeated in Huh7 cells (4th and 5th panels, mean ± SEM, n = 3 to 5, **P < 0.01, ***P < 0.05).
Supplemental Material
Download Zip (7.4 MB)Data availability statement
The authors confirm that the data supporting the findings of this study are available within the article and its supplementary materials.