
Figures & data
Figure 1. DENV infected Huh7 cells at different time points. (A)RT-PCR (B) qPCR analysis and (C) and (D) Western blot analysis showed decrease in the ANG levels at the initial stages of replication while an increase was observed at the later stage of DENV replication (E) and (F) heat inactivated DENV infection was given at different time points (0 h, 24 h and 48 h) and the endogenous levels of angiogenin were compared with the mock levels. Heat inactivated DENV (HI-DV) virus does not show any effect on angiogenin level.
Figure 2. siRNA mediated knockdown of Angiogenin in DENV-Infected and uninfected cells A) qPCR analysis shows the knockdown efficiency evaluated by reverse transfecting the cells with 10 nM and 30 nM of control siC or siANG, followed by cell harvested at various time points (24 hours, 48 hours, and 72 hours). It was observed that ANG levels were reduced by approximately 65% up to 72 hours post-transfection with siANG, in the absence of DENV infection. (B) and (C) the efficacy of angiogenin knockdown was confirmed through Western blot analysis conducted at 24 hours and 72 hours following transfection. In the absence of DENV infection, a significant reduction of approximately 80% in angiogenin expression was observed 72 hours post-transfection. (D) qPCR showing angiogenin levels upon 24hrs of siC or siANG transfection, followed by DENV infection. Cells were harvested at 48hpi. Angiogenin levels were found to be increased upon DENV infection.
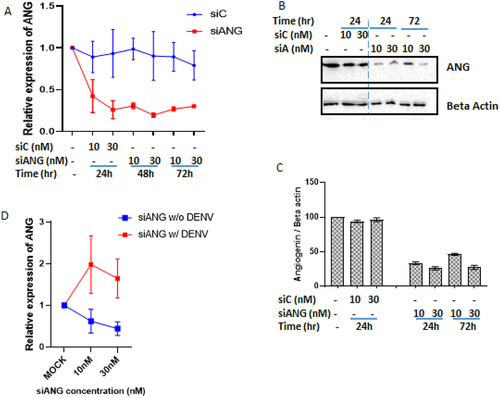
Figure 3. Angiogenin expression at various time points during siRNA mediated knockdown of angiogenin in presence of DENV infection (A) qPCR analysis: shows angiogenin levels upon DENV infection at different time points following 24hrs of angiogenin knockdown. The angiogenin levels were assessed at different time post infection (0 hr, 4 h, 8 h 12 h 24 h, 48 h). Angiogenin levels found to be increased immediately after DENV adsorption (0th hpi) and the levels further changes with the increasing time post infection. For further validation, (B and C) Western blot analysis was conducted, yielding similar results as the qPCR analysis. The levels of angiogenin were found to increase with the duration of DENV infection. Cytotoxicity assay of angiogenin knockdown cells and angiogenin knockdown (KD) followed by DENV infected cells. (D) cell cytotoxicity at 24hrs of angiogenin KD followed by 24hrs of DENV infection. (E) cell cytotoxicity at 24hrs of angiogenin KD followed by 48hrs of DENV infection.
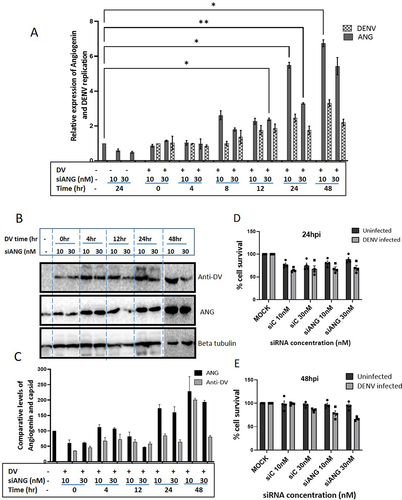
Figure 4. Ivermectin treatment leads to a reduction in the DENV replication and the expression Angiogenin: Huh7 cells were pre-treated with (A) 50 µM ivermectin (IV) and (B) DMSO for 4 h followed by DENV infection. Cells were harvested at different time points and the results were analysed with qRT-PCR. A decrease in the levels of angiogenin was observed with the decrease in DENV replication in case of ivermectin treated cells, while no effect was seen in DMSO treated cells. Cytotoxicity assay during IV/DMSO treatment with and without DENV infection was observed at (C) 24 hr (D) 48 hr and (E) 72 hr. Percent cell survival was found to be similar in IV/DMSO in presence of DENV infection as compared to only IV/DMSO treated condition.
Supplemental Material
Download MS Word (159 KB)Data availability statement
All data described within the article are included in this article.