
Figures & data
Figure 1. BIRC5 expression in breast cancer. (A) BIRC5 mRNA expression in invasive ductal breast cancer patients compared with normal patients. (B and C) BIRC5 mRNA and protein expression in the breast cancer cell lines MDA-MB-231, MCF-7, and T47D and the normal mammary cell line MCF10A. TTP and HuR protein levels were also examined in these cells. Cells were seeded in 6-well plates overnight. RNA and protein were extracted the following day for RT-qPCR and immunoblotting. BIRC5 mRNA was quantified using TaqMan specific primers and normalized to endogenous RPLPO. Protein levels were detected using anti-BIRC5, anti-TTP, and anti-HuR antibodies and normalized to GAPDH as the endogenous control. Results are from one experiment representative of three independent experiments. Statistical significance was achieved by one-way ANOVA with Dunnett's post-hoc multiple comparison test using MCF10A as the control, ****P < 0.0001.
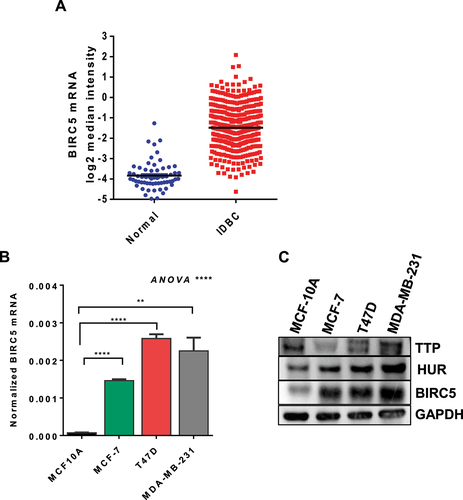
Figure 2. Breast cancer patient survival curves for high and low BIRC5 mRNA expression. (A-C) Kaplan–Meier curves for overall survival (OS), relapse-free survival (RFS), and distant metastasis-free survival (DMFS) were obtained from the KM-plotter portal. (D) assessment of BIRC5 are reporter activity. HEK293 cells were transfected with 25 ng of RPS-30 promoter-linked Nano-luciferase reporters containing BIRC5 ARE, BIRC5 3' UTR, BIRC5 mutated ARE, or TNF 3' UTR as a positive control. BGH 3' UTR was used as the negative control. Luciferase activity was measured after 24 h of transfection and presented as percent of control. Results are from one experiment representative of three independent experiments, *** P < 0.001, **** P < 0.0001 (Student’s t-test). (E) assessment of reporter mRNA stability. Cells were transfected with RPS30M1-nluc-DU reporters containing BIRC5 ARE, BIRC5 3' UTR, BIRC5 mutated ARE, or TNF 3' UTR as a positive control. BGH 3' UTR was used as the negative control. Cells were treated with ActD (5 ug/ml) for the times indicated and RNA was extracted for RT-qPCR. Results are from one representative experiment of two independent experiments.
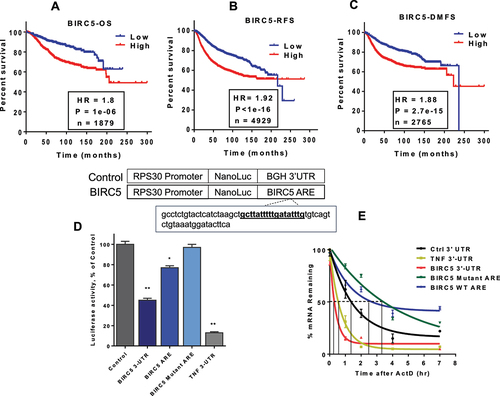
Figure 3. BIRC5 correlation with TTP and HuR. (A and B) Pearson correlation plots of BIRC5 and TTP mRNA expression levels or BIRC5 and HuR for invasive ductal breast cancer patients obtained from the oncomine portal. Linear regression and R values were generated and are shown. Immunoprecipitation of TTP-associated BIRC5 mRNA, in MDA-MB-231 cells. (C) Cells were seeded and transfected the following day with TTP or mutant TTP (C124R) plasmid (2 ug/100 cm plate). TTP protein was immunoprecipitated using anti-TTP or IgG as a negative control and associated BIRC5 mRNA quantification was done by RT-qPCR and normalized to RPLPO. Data are from two independent experiments. **P < 0.005, ****P < 0.0001 (Student’s t-test) (D) HEK293 cells were transfected with HA-tagged TTP plasmid (2 ug/100 cm plate) and TTP protein was immunoprecipitated using anti-HA-coupled beads or anti-myc-coupled beads as a negative IP control. BIRC5 mRNA binding enrichment was assessed by RT-qPCR using a FAM-labelled probe for BIRC5 and normalized to VIC-labelled RPLPO. Data are from two independent experiments. ****P < 0.0001 (Student’s t-test). Immunoprecipitation of HuR-associated BIRC5 mRNA, (E) HEK293 cells were transfected with myc-tagged HuR plasmid (2 ug/100 cm plate) and HuR protein was immunoprecipitated using anti-myc-coupled beads or anti-HA-coupled beads as a negative IP control. BIRC5 mRNA binding enrichment was assessed by qPCR and normalized to RPLPO. Data are from two independent experiments. ***P < 0.005 (Student’s t-test). (F) competitive binding immunoprecipitation assay. HEK293 cells were transfected with myc-tagged HuR plasmid alone or co-transfected with HA-tagged TTP plasmid. Anti-myc antibody was used to precipitate HuR protein in HuR and TTP transfected samples and IgG was used as the control. BIRC5 mRNA binding enrichment was assessed by RT-qPCR using a FAM-labeled probe for BIRC5 and normalized to VIC-labeled RPLPO. Data are from two independent experiments. ****P < 0.0001 (Student’s t-test).
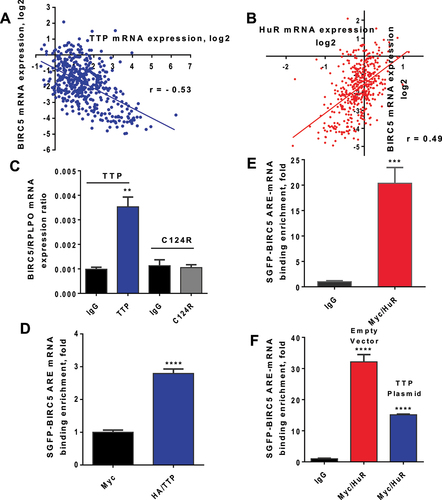
Figure 4. TTP regulation of BIRC5 expression and apoptosis. (A) MDA-MB-231 cells were transfected with increasing amounts of HA-tagged TTP plasmid. Total protein was extracted after 24 h for immunoblotting using anti-HA, anti-BIRC5, anti-full-length and cleaved caspase 3, and anti-β-actin as the loading control. (B and C) MDA-MB-231 cells were transfected as in (A) and after 24 h, cells were harvested and fixed for Annexin V or cleaved-caspase 3 staining, *P < 0.05, **P < 0.01 (Student’s t-test). Results are from one experiment representative of three independent experiments. Reporter assessment of TTP induction. (D) HEK293 Tet-ON cells were transfected with 25 ng of RPS-30 promoter-linked Nano-luciferase reporters containing BIRC5 ARE, BIRC5 3' UTR, BIRC5 mutated ARE, or TNF 3' UTR as a positive control and co-transfected with a Tet-O-inducible TTP expression plasmid (10 ng) as described in materials and methods. BGH 3' UTR was used as the negative control. To induce TTP, doxycycline (0.25 µM) was added and luciferase activity was measured after 24 h, *P < 0.05, ****P < 0.0001 (Student’s t-test). Effect of BIRC5 knockdown on apoptosis. (E & F) MDA-MB-231 cells were transfected with siBIRC5 or control siRNA for 24 h. Cells were harvested for immunoblotting or fixed for Annexin V assay, *P < 0.05 (Student’s t-test). Immunoblotting was performed using anti-BIRC5, anti-full-length and cleaved caspase 7, or anti-β-actin as the loading control.
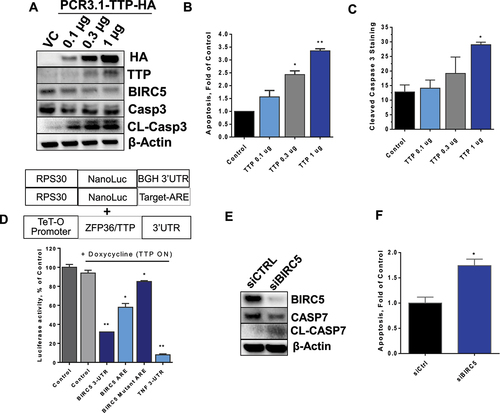
Figure 5. Survival analysis of TTP and BIRC5 co-expression. (A-C) Kaplan-Meier survival curves were generated using the KMplot portal. OS, RFS, and DMFS survival curves were generated in which expression levels were split into high and low TTP, based on the best cut-off option, with inverted BIRC5 mRNA expression (e.g. high TTP, low BIRC5). (D and E) RFS and DMFS survival curves were generated as in (A-C) using only ER/PR positive data.
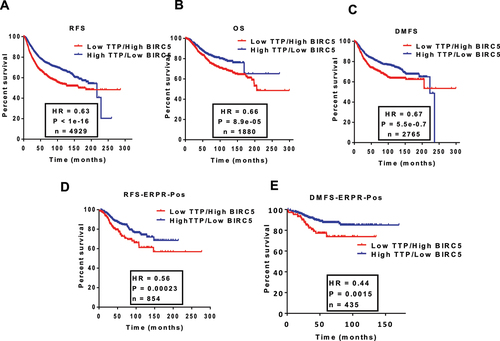
Figure 6. Birc5 mRNA expression in the absence of TTP. (A and B) zfp36+/+ and zfp36−/− MEFs were seeded at 70% confluency overnight then total protein or RNA were extracted for immunoblotting or RT-qPCR. Birc5 mRNA expression was measured with TaqMan specific primers for mouse Birc5 and normalized to mouse β -actin. Data are from one experiment representative of three independent experiments, *** P < 0.0001 (Student’s t-test). Birc5 protein expression was assessed by probing with anti-mouse Birc5 antibody and anti-mouse β-actin as the loading control. Data are from one experiment representative of two independent experiments. (C) BIRC5 mRNA stability in TTP wild-type and knockout MEFs. Cells were seeded in 6-well plates in incubated in regular serum overnight. Cells were serum-starved the next day by replacing media with low-serum media (0.5% FBS) for 18 h then re-stimulated with 10% serum for 2 h followed by addition of Actinomycin D (ActD, 5 µg/ml) to the cells. Total RNA was extracted at 0, 2, 4, 8, and 24 h for RT-qPCR using TaqMan expression assays for mouse Birc5 and β-actin as the endogenous control. The one-phase decay model was used to estimate BIRC5 mRNA half-life. The data are from one experiment representative of two independent experiments.
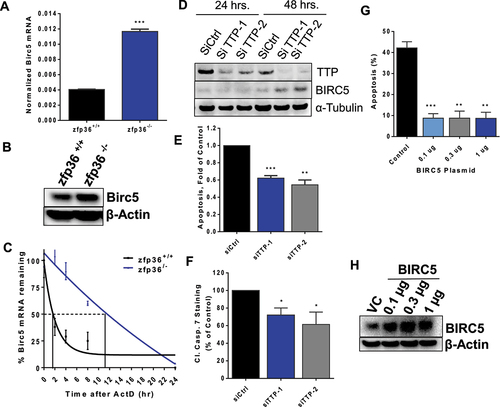
Figure 7. HuR regulation of BIRC5 expression. (A) MCF10A cells were transfected with HuR plasmid or empty vector for 24 h. Total RNA was then extracted for RT-qPCR using BIRC5 TaqMan expression assay and normalized to human RPLPO. The data are from one experiment representative of three independent experiments, **P < 0.005 (Student’s t-test). (B) MCF10A cells were transfected as in (A) for 24 and 48 h. Total protein was extracted for immunoblotting with anti-HuR, anti-BIRC5, anti- full-length and cleaved caspase 3 and anti- β-actin as the loading control. MDA-MB-231 cells were transfected with two siRNAs against HuR or a control siRNA for 48 h and either; (C) total RNA was extracted for RT-qPCR using a BIRC5 TaqMan probe and normalized to human RPLPO, **P < 0.005 (Student’s t-test), or (D) total protein was extracted for immunoblotting and probed with anti-HuR, anti-BIRC5, anti-full-length and cleaved caspase 3, and anti-tubulin as the loading control, or (E) cells were fixed for Annexin V assay. Survival analysis of HuR and BIRC5 co-expression. (F-H) Kaplan-Meier survival curves were generated using the KMplot portal. OS, RFS, and DMFS survival curves were generated wherein expression levels were split into high and low HuR and BIRC5 (co-expression, non-inverted) based on the best cut-off option, (e.g. high HuR, high BIRC5).
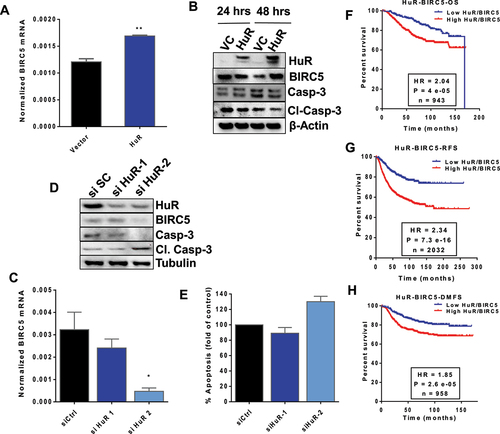
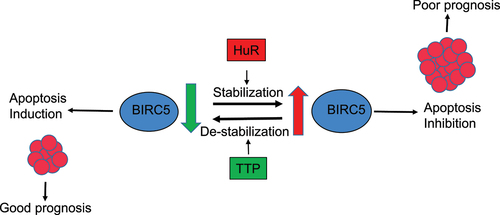
Figure 8. Schematic illustration of TTP and HuR regulation of BIRC5 and apoptosis. The RNA binding proteins TTP and HuR both bind to BIRC5 mRNA. TTP binding leads to ARE-mediated destabilization of BIRC5 mRNA and reduced expression. This eventually induces apoptosis in cells resulting in less proliferation and, thus, predicts a good prognosis. On the other hand, HuR stabilizes BIRC5 mRNA, increasing its expression leading to the inhibition of apoptosis and supporting cell proliferation. Upregulation of both HuR and BIRC5 results in a worse prognosis than BIRC5 alone.
SupplementaryDataSetDetails_RNB_NAS_May2023.xlsx
Download MS Excel (110.1 KB)Supplementary Material_RNB_NAS_Nov2023.docx
Download MS Word (15.5 KB)Supplemental Figures_RNB_NAS_Nov2023.pdf
Download PDF (641.1 KB)Data availability statement
Data sharing is not applicable to this article as no datasets were generated or analysed during the current study.