
Figures & data
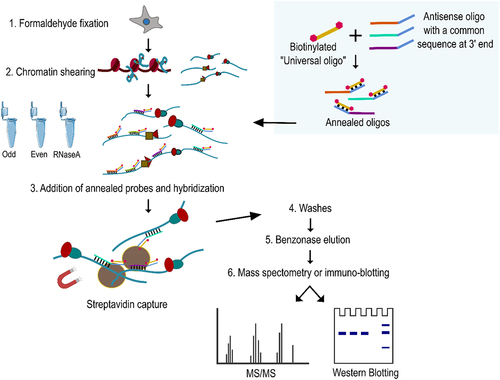
Figure 1. NEAT1 pulldown using MORPH (A) semi quantitative PCR using NEAT1 primers to assess enrichment of NEAT1 after MORPH-based pulldown in even, odd and RNaseA groups. Schematic indicate the relative position of primer binding (B) correlation plot of the Log2FC of the proteins detected in the ODD and EVEN set of oligos. (Pearson’s correlation of 0.91). (C) subcellular distribution of the proteins detected by MORPH-MS.
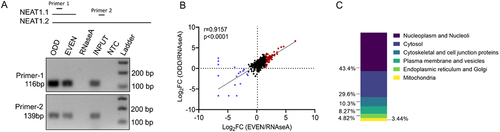
Figure 2. Gene ontology of the NEAT1 interacting proteins (A) bar graph depicting the enrichment score of the mentioned GO terms under biological processes (BP), Cellular component (CC) and Molecular function (MF) category. (B) heatmap showing the enrichment of the RNA splicing proteins detected in the ODD and EVEN pulldowns (C) heatmap showing the enrichment of the paraspeckles proteins in the ODD and EVEN sets of pulldown.
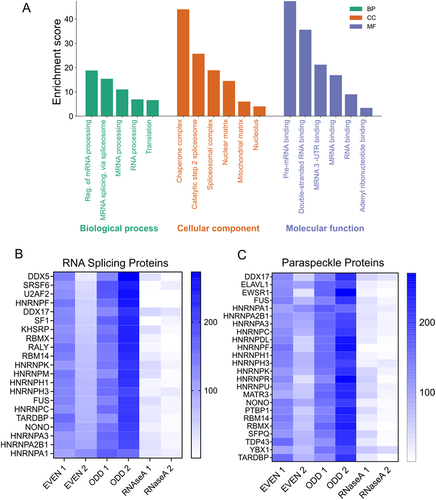
Table 1. Comparing MORPH with different antisense oligo-based capture techniques.
Figure 3. Validation of MORPH (A) venn diagram showing the number of common NEAT1 interacting proteins detected using CHART and MORPH-MS (Fisher exact test, p = 4.833e-89). (B) Venn diagram showing the number of common NEAT1 interacting proteins detected using CHART and HyPR-MS (Fisher exact test, p = 1.25e-08). (C) Venn diagram showing the number of common paraspeckle proteins detected by MORPH-MS (Fisher exact test, p = 6.49e-34). (D) Western blot after performing RNA pulldown via MORPH (MORPH-WB) using anti-SFPQ, anti-RBM14, anti-HNRNPK, and anti-RALY. (E) qRT-PCR using NEAT1 primers after performing RNA-IP from AC16 cell lysates using antibodies against SFPQ, RBM14, HNRNPK, and RALY. IgG was used as negative control.
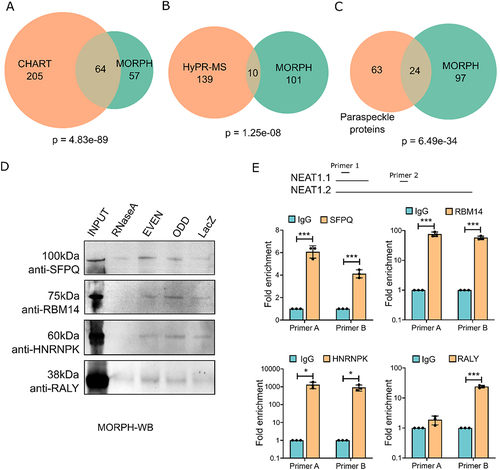
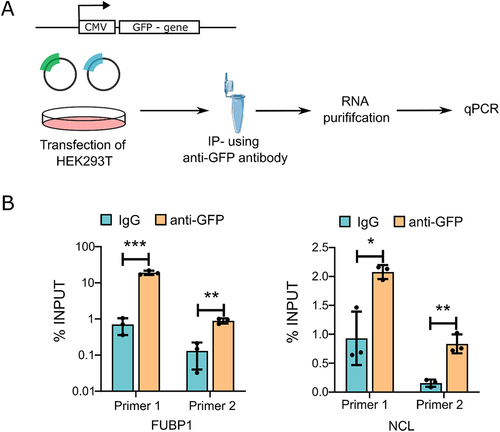
Figure 4. Validation of proteins by RNA-IP qPCR (A) schema depicting the RNA-IP experiment. (B) qRT-PCR using NEAT1 primers after performing RNA-IP from HEK293T cell lysates using anti-GFP antibody to enrich FUBP1 and NCL. IgG was used as the negative control.
Supplemental Material
Download Zip (3.9 MB)Data availability statement
Processed mass spectrometry data are included as supporting files. Raw data were generated at the CSIR-Centre for Cellular and Molecular Biology. Raw data supporting the findings of this study are available from the corresponding author RK on request.