
Figures & data
Figure 1. CoA-RNA synthesis by PPAT. (A) analogous reactions of pPant + ATP and pPant + ATP-RNA produce dpCoa (top) and CoA-RNA (below). (B) in vitro capping assays identify the necessary conditions for PPAT-catalyzed BK-CoA-RNA synthesis from reaction of 14C-labelled BKPP (a pPant analog, scheme S1) with unlabelled pppA-RNAI (left panel), 32P-labelled pppA-RNAI (middle panel), and 32P-labelled pppG-RNAI (right panel). In the left panel, only BK-capped RNAI but unreacted RNAI is visible. Streptavidin-BK-CoA-RNAI complex migrates more slowly than BK-CoA-RNAI. In the middle and right panels, both RNAI and BK-capped RNAI are visible, but BK-capped RNAI is not resolved from RNAI in the absence of streptavidin (middle panel, lane 2). Formation of streptavidin-BK-capped RNAI complex allows for BK-capped RNAI separation and detection (middle panel, lane 4). RppH treatment of pppRNA removes its 5’ pyrophosphate to yield pRNA, which does not react with PPAT.
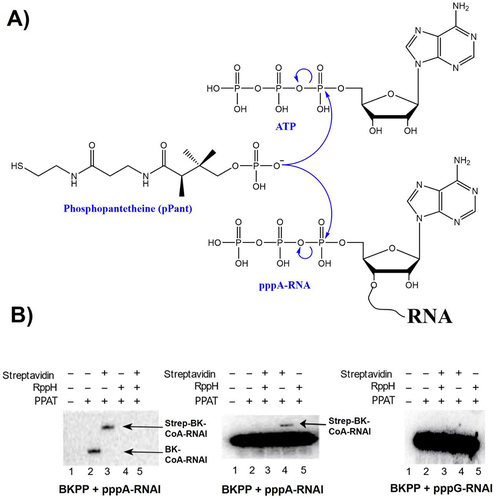
Figure 2. Characterization of CoA-RNA synthesis by PPAT. (A) HPLC and (B) mass spectrometry were used to analyze nuclease P1 digestion products of reactions performed with (solid line) or without (dashed line) PPAT for 4 h. Panel B shows a product peak having the same retention time as genuine dpCoa and a characteristic ‘adenosine’ UV spectrum (inset, obtained from an online PDA detector). The observed m/z ratio matches the expected value for dpCoa (B). (C) in vitro capping kinetic assays were carried out using 10 µM internally 32P-labelled 5 mer pppRNA (SI Appendix fig. S5), 500 nM PPAT, and either pPant (left panel) or BKPP (right panel). pPant and BKPP substrates were used at concentrations of 10, 20, 50 and 200 µM, and reactions were carried out for 0, 60, 120, or 240 min. (D) plots of capped RNA product concentrations vs reaction time for CoA-RNA (left) and BK-CoA-RNA (right) formation. Linear regression was used to derive the initial velocity (V0) at a defined substrate concentration [pPant] or [BKPP]. Since the product formation was < 5% of the total RNA, product inhibition was negligible. The V0 values were then used to estimate the maximum velocity at 10 µM RNA and saturating [pPant] or [BKPP], Vmax, and kcat (SI Appendix fig. S6 and kinetic description).
![Figure 2. Characterization of CoA-RNA synthesis by PPAT. (A) HPLC and (B) mass spectrometry were used to analyze nuclease P1 digestion products of reactions performed with (solid line) or without (dashed line) PPAT for 4 h. Panel B shows a product peak having the same retention time as genuine dpCoa and a characteristic ‘adenosine’ UV spectrum (inset, obtained from an online PDA detector). The observed m/z ratio matches the expected value for dpCoa (B). (C) in vitro capping kinetic assays were carried out using 10 µM internally 32P-labelled 5 mer pppRNA (SI Appendix fig. S5), 500 nM PPAT, and either pPant (left panel) or BKPP (right panel). pPant and BKPP substrates were used at concentrations of 10, 20, 50 and 200 µM, and reactions were carried out for 0, 60, 120, or 240 min. (D) plots of capped RNA product concentrations vs reaction time for CoA-RNA (left) and BK-CoA-RNA (right) formation. Linear regression was used to derive the initial velocity (V0) at a defined substrate concentration [pPant] or [BKPP]. Since the product formation was < 5% of the total RNA, product inhibition was negligible. The V0 values were then used to estimate the maximum velocity at 10 µM RNA and saturating [pPant] or [BKPP], Vmax, and kcat (SI Appendix fig. S6 and kinetic description).](/cms/asset/be95d0f1-f294-4fa4-87b4-2fba6b9c54b5/krnb_a_2288740_f0002_oc.jpg)
Figure 3. Requirements for CoA-RNA formation by PPAT. (A) six model RNA sequences (22 nucleotides each) containing a stable stem-loop structure with variable distances from the 5’ termini. (B) BK-CoA-RNA formation using 14C-labelled BKPP and unlabelled pppRNA from (A). The enzyme accepts D4, D5, D7, and D10 RNA as substrates but not D2 or D3 RNA. (C) relative PPAT binding affinities for D2 and D7 RNA were determined in nitrocellulose filter binding assays using trace amounts of radiolabelled RNA and the indicated PPAT concentrations; n = 3 independent measurements for all binding assays. (D) sequences and predicted secondary structures (mfold) for D2* and D7* RNAs. Red nucleotides are indices used for in vivo activity evaluations (fig. 4). (E) evaluation of D2* and D7* RNA binding to PPAT as in (C); n = 3. (F) evaluation of D7, D7 + 1 G, and D7 5’ OH RNA binding to 1 or 3 μM PPAT. (G) D4 and D10 relative rate comparison by incubating 10 μM D4 and D10 RNA at 37°C with 200 μM BKPP and 500 nM PPAT for 1–4 hr. Products were separated by PAGE and visualized by phosphorimaging. The band intensity (counts/mm2) was plotted against incubation time, and linear regression was used to derive the slope (counts/mm2/min), yielding similar reaction rates. (H) ATP inhibition of CoA-RNA synthesis using 500 nM PPAT, 200 μM pPant and 10 µM 32P-labelled 5 mer pppRNA, 4 h at 37°C.
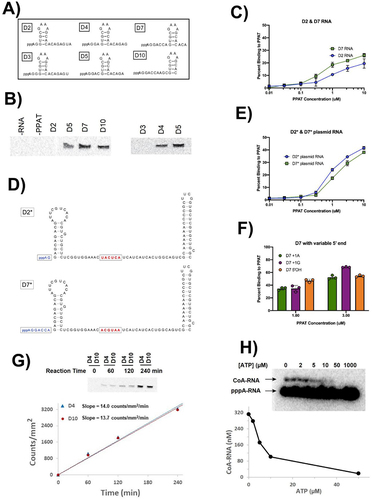
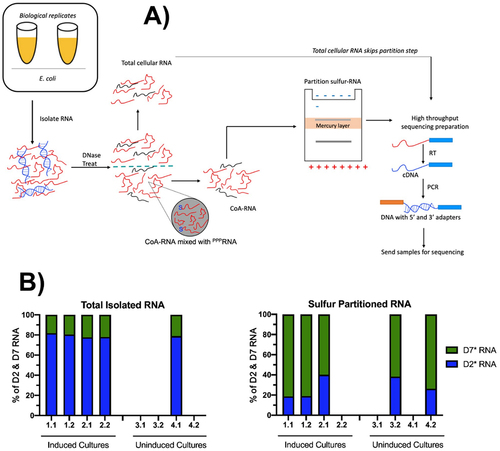
Figure 4. Capturing cellular CoA-RNAs capped in vivo. (A) schematic of CoA CaptureSeq method summarizing the various steps to isolate, prepare, partition, and sequence CoA-RNAs from total RNA. RNA isolated from duplicate bacterial cultures were each separated into two technical replicates prior to DNase treatment. Sulphur-containing samples were partitioned on an APM gel, then RT-PCR amplified for high-throughput sequencing. (B) reads corresponding to D2* (blue) and D7* (green) RNAs were identified by their respective index sequences (fig. 3D), and their relative proportions in each sample were determined for total RNA (left) and CoA-RNA partitioned (right) samples. Samples with fewer than 2,000 total unique processed reads (SI Appendix Tables S1 & S2) were excluded from these data sets.
CoA RNA SI.pdf
Download PDF (1.6 MB)Data availability statement
The authors confirm that the data supporting the findings of this study are available within the article and its supplementary materials.