
Figures & data
Figure 1. CCAR-1 regulates alternative splicing. A. Methodology of RNA sequencing samples preparation between N2 and CCAR-1 null (SDW040) worms B. Types of alternative splicing events occurring from the VAST Tools analysis, including exon skipping (EX), intron retention (INT), alternative splice acceptor (ALTA) and alternative splice donor (ALTD). C. WormEnrichR analysis of gene ontology (GO) molecular function between N2 and CCAR-1 null (SDW040) worms. D. WormEnrichR analysis of gene ontology (GO) biological process between N2 and CCAR-1 null (SDW040) worms.
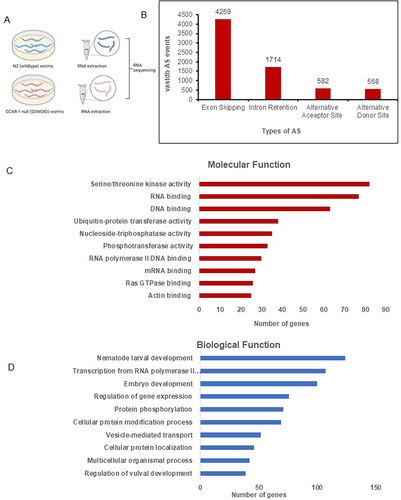
Table 1. Top 20 alternatively spliced genes between N2 (wildtype) and CCAR-1 null (SDW040) worms.
Figure 2. RT-PCR validation of alternatively spliced genes. This figure shows the RT391 PCR validation of CCAR-1-regulated alternative splicing from the RNA sequencing dataset. A. The RT-PCR images show the visual representation of isoform changes in the N2 and CCAR-1 null (SDW040) worms. B. The box plots represent the distribution of the isoform ratios of all populations of N2 and CCAR-1 null (SDW040) worms, N=7. The F30F8.10 box plot measures the ratio of isoform A to C and the tos-1 box plot measures the ratio of isoform A to B. Based on a Mann-Whitney test, we recorded a p-value of 0.006 (***) for the F30F8.10 gene and a p-value 0f 0.0401 (*) for the tos-1 gene.
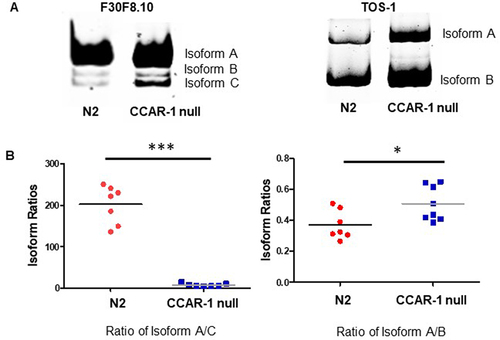
Figure 3. CCAR-1RNAi affects the alternative splicing of the tos-1 splicing reporter in UAF-1 mutants. A. Shows the tos-1 pre-mRNA and subsequent isoforms due to alternative splicing B. The RT-PCR results of N2, CCAR-1 null (SDW040), UAF-2 mutant (VC3010), and UAF-1 mutant (MT16492) (with and without ccar-1 RNAi). C. Shows the isoform ratios of isoform a to D in N2, CCAR-1 null (SDW040), UAF-2 mutant (VC3010), and UAF-1 mutant (MT16492) (with and without ccar-1 RNAi) D. Shows the isoform ratios of isoform C to D in N2, CCAR-1 null (SDW040), UAF-2 mutant (VC3010), and UAF-1 mutant (MT16492) (with and without ccar-1 RNAi). The error bars in C and D represent the standard error and variability of isoform ratios from different replicates.
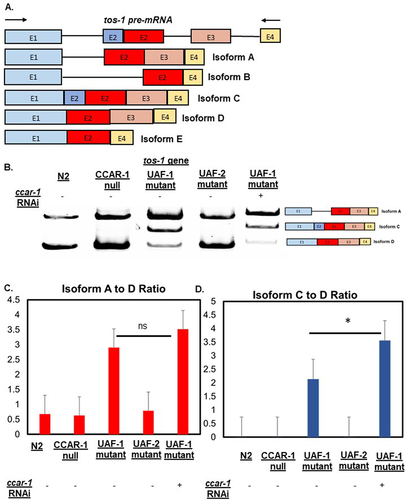
Figure 4. CCAR-1RNAi rescues the motility of UAF-1 mutants. N2 and UAF-1 mutant (MT16492) grown at 25°C, were assessed for motility in a thrashing assay. Body bends per minute were measured for individual worms in an N = 15 for two biological replicates. Based on a Mann-Whitney test, we recorded a p-value of < 0.0057 between N2 EV and N2 ccar-1 RNAi and a p-value of < 0.0001 between UAF-1 mutants (MT16492) EV and UAF-1 mutants (MT16492) ccar-1 RNAi.
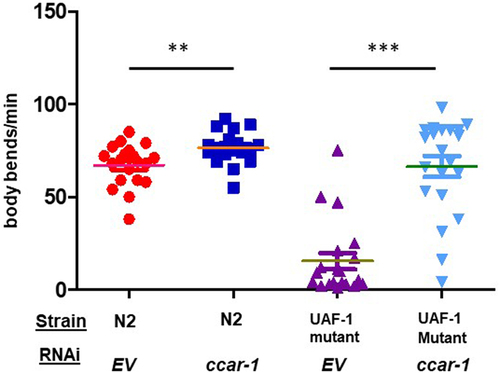
Figure 5. Ccar-1 and uaf-1 RNAi significantly decrease polyglutamine aggregation. A. Shows the fluorescent images of AM140 (Q35:YFP) fed control, ccar-1, uaf-1, and ccar-1/uaf-1 RNAi from L1 larval stage to day 3 of adulthood. B. Shows quantification of the number of aggregates per worm in each condition with an N = 40. Based on a Mann-Whitney test, we recorded a p-value of 0.0001 (***) between AM140 empty vector (EV) and AM140 ccar-1 RNAi, and a p-value of 0.0001 (***) between AM140 uaf-1, and AM140 uaf-1/ccar-1 RNAi.
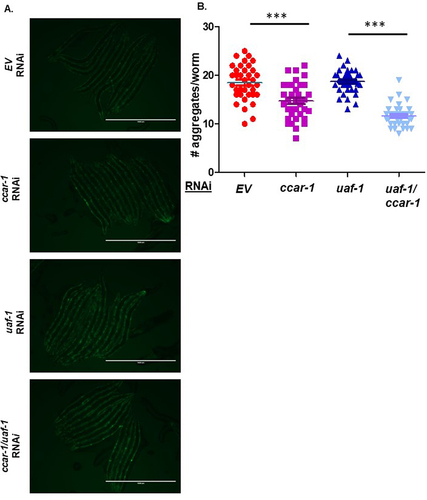
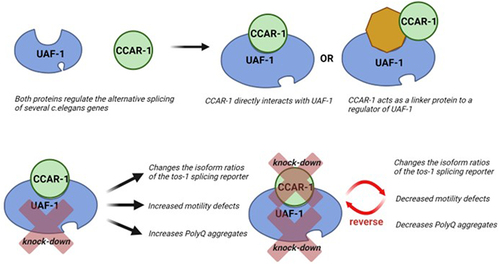
Figure 6. A model of the mechanism of action of alternative splicing regulation by CCAR-1 and UAF-1 inC. elegans.
Supplementary Data 3.pdf
Download PDF (85.1 KB)Reviewer Data 2.pdf
Download PDF (17.4 MB)Supplementary Data 1.pdf
Download PDF (5.6 MB)CCAR1_manuscript_figure_license.pdf
Download PDF (229.6 KB)Supplementary Data 4.pdf
Download PDF (411 KB)Supplementary Data 2.pdf
Download PDF (174 KB)Reviewer Data 1.pdf
Download PDF (184.9 KB)Data availability statement
The data that supports the findings of this study are openly available in the Sequence Read Archive (SRA) website https://submit.ncbi.nlm.nih.gov/subs/sra, reference number SUB8460771.