
Figures & data
Figure 1. A schematic overview of the HIV-1 replication cycle. The entry of HIV-1 begins with the binding of the HIV-1 virion to the cell membrane through the interactions of the envelope-glycoproteins (Env) with the cell membrane receptors (step 1). This is followed by the fusion of the virion with the cell membrane and entry of the viral particle into the cell (step 2). While the gRNA strands are reverse transcribed into vDNA, the viral core gets transported to the cell nucleus (steps 3–4). vDNA generated through the reverse transcription process is further integrated into the host-cell chromosome (step 5). Upon completion of the integration step, proviral DNA gets transcribed into vRNA molecules which are exported into the cytoplasm (steps 6–7). The vRNA molecules are then either translated into viral proteins or assembled for further packaging with newly synthesized protein molecules (steps 8–9). The assembled viral particle buds on the cell membrane using newly synthesized viral proteins and gRNA and is further released from the cell membrane upon completion of the assembly step (steps 10–11). The release is followed by the maturation process to produce an infectious viral particle (step 12).
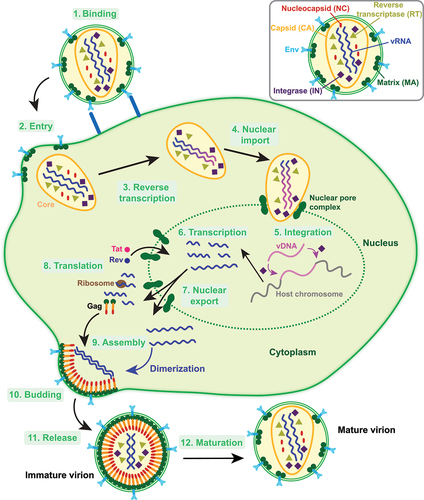
Figure 2. The initiation complex of the HIV-1 reverse transcription. Shown are (A) the secondary structures of the PBS-segment RNA and the primer with various structural motifs uniquely colored and labeled; (B) the side-view snapshot of the PBS-segment RNA with key structural motifs uniquely colored and labeled following the color scheme defined in panel A (PDB 7LVA) [Citation47]; and (C) the side-view snapshot of the ARL anticodon of the
(pink) annealed to the ARL (blue) of the HIV-1 TLE (light blue; PDB 2K7E) [Citation46]. The modifications in the ARL anticodon motif are highlighted in red. The snapshots in panels B and C utilize the first frame of the corresponding NMR structure. (D) The side-view snapshot of the HIV-1 reverse transcription initiation complex (PDB 6HAK) [Citation48] is shown with two RT domains, the p66 and p51 domains, highlighted in light blue and pink, respectively. The dsRNA structure is colored following the color scheme in panel A. (E) Two conformations of the
end of the anti-PBS segment of the
primer annealed to PBS at the RTIC are shown along with the vDNA strand from the elongation complex at the P site (PDBs 6B19, 6HAK, 5TXL) [Citation48–50]. The primer conformations correspond to superimposed functional states of the RTIC on the elongation complex with vDNA: state 1 (dark orange;
+1) and state 2 (light orange;
) and the elongation complex (white; P).
![Figure 2. The initiation complex of the HIV-1 reverse transcription. Shown are (A) the secondary structures of the PBS-segment RNA and the tRNA3Lys primer with various structural motifs uniquely colored and labeled; (B) the side-view snapshot of the PBS-segment RNA with key structural motifs uniquely colored and labeled following the color scheme defined in panel A (PDB 7LVA) [Citation47]; and (C) the side-view snapshot of the ARL anticodon of the tRNA3Lys (pink) annealed to the ARL (blue) of the HIV-1 TLE (light blue; PDB 2K7E) [Citation46]. The modifications in the ARL anticodon motif are highlighted in red. The snapshots in panels B and C utilize the first frame of the corresponding NMR structure. (D) The side-view snapshot of the HIV-1 reverse transcription initiation complex (PDB 6HAK) [Citation48] is shown with two RT domains, the p66 and p51 domains, highlighted in light blue and pink, respectively. The dsRNA structure is colored following the color scheme in panel A. (E) Two conformations of the 3′ end of the anti-PBS segment of the tRNA3Lys primer annealed to PBS at the RTIC are shown along with the vDNA strand from the elongation complex at the P site (PDBs 6B19, 6HAK, 5TXL) [Citation48–50]. The primer conformations correspond to superimposed functional states of the RTIC on the elongation complex with vDNA: state 1 (dark orange; P′+1) and state 2 (light orange; P′) and the elongation complex (white; P).](/cms/asset/f4f7df7e-1e27-4a4b-9a04-63adc4130f72/krnb_a_2289709_f0002_oc.jpg)
Table 1. Structural data on the HIV-1 RNA elements participating in reverse transcription. For each structure, shown is the HIV-1 RNA identifier, the corresponding pdb, the binding partner/ligand, the experimental method used to resolve the structure, and the publication year. The following abbreviations are used: ARL, A-rich loop; cryo-EM, cryo-electron microscopy; NCp7, nucleocapsid protein 7; NMR, nuclear magnetic resonance; PBS, primer binding site; RT, reverse transcriptase; TAR, transactivation response element. Furthermore, RNA/DNA is used to indicate the RNA/DNA hybrid.
Figure 3. TAR RNA and its complexes with various ligands. Shown is (A) the secondary structure of the HIV-1 TAR RNA highlighting various structural motifs (loop, helix 2, bulge, helix 1) that are labeled and colored uniquely; (B) the snapshots of TAR RNA (stick representation) bound to various peptides (left; labeled counterclockwise light orange) and to small-molecules (right; labeled counterclockwise light blue). The ligands are shown in space-filling representations [Citation86–95] with the apo conformation of TAR RNA (PDB 1ANR) shown at the center of the panel [Citation96]; (C) the sequences of the 2–
3 loops from four lab-evolved TBPs with key arginine residues highlighted in boxes; (D) the cartoon representation of superimposed TBPs bound to TAR RNA with the
2–
3 loops and the key arginine residues and RNA nucleotides (stick representations) highlighted in unique colors following the color scheme in panel C [Citation97,Citation98]; (E) the snapshot of the TBP6.7 binding site with key arginine residues depicted with sticks (PDB 6HX1) [Citation97]; and (F) the snapshot of the G1G truncated joint region between TAR RNA and PolyA RNA along with the truncated secondary structure (PDB 7DD4) [Citation51]. The
-terminal G2 and G3 nucleotides and the
-terminal UG nucleotides are highlighted in unique colors.
![Figure 3. TAR RNA and its complexes with various ligands. Shown is (A) the secondary structure of the HIV-1 TAR RNA highlighting various structural motifs (loop, helix 2, bulge, helix 1) that are labeled and colored uniquely; (B) the snapshots of TAR RNA (stick representation) bound to various peptides (left; labeled counterclockwise light orange) and to small-molecules (right; labeled counterclockwise light blue). The ligands are shown in space-filling representations [Citation86–95] with the apo conformation of TAR RNA (PDB 1ANR) shown at the center of the panel [Citation96]; (C) the sequences of the β2–β3 loops from four lab-evolved TBPs with key arginine residues highlighted in boxes; (D) the cartoon representation of superimposed TBPs bound to TAR RNA with the β2–β3 loops and the key arginine residues and RNA nucleotides (stick representations) highlighted in unique colors following the color scheme in panel C [Citation97,Citation98]; (E) the snapshot of the TBP6.7 binding site with key arginine residues depicted with sticks (PDB 6HX1) [Citation97]; and (F) the snapshot of the G1G truncated joint region between TAR RNA and PolyA RNA along with the truncated secondary structure (PDB 7DD4) [Citation51]. The 5′-terminal G2 and G3 nucleotides and the 3′-terminal UG nucleotides are highlighted in unique colors.](/cms/asset/6ba6f735-c6bf-435f-9d78-f324bf270dae/krnb_a_2289709_f0003_oc.jpg)
Table 2. Structural data on the HIV-1 RNA elements participating in transcription. Data similar to are shown for the HIV-1 RNA elements participating in transcription, and the following additional abbreviations are used: G-quadruplex, guanine-rich quadruplex; SEC, super elongation complex; Tat, transactivator of transcription; TBP, TAR-binding protein.
Figure 4. Tat protein in complex with 7SK RNA and TAR RNA. Shown are the side-view snapshots of the Tat protein bound to (A) human 7SK RNA (PDB 6MCF) and (B) TAR RNA (PDB 6MCE) [Citation99]. In both snapshots, RNA is shown in a cartoon representation (gray), Tat backbone is shown in a tubular representation (yellow), the atoms of those arginine residues which participate in key interactions with both RNA molecules are shown in red spheres, while other arginine residues are shown in blue spheres. The zoomed snapshots correspond to specific interactions formed between the arginine residues in Tat (red sticks) and the RNA nucleotides.
![Figure 4. Tat protein in complex with 7SK RNA and TAR RNA. Shown are the side-view snapshots of the Tat protein bound to (A) human 7SK RNA (PDB 6MCF) and (B) TAR RNA (PDB 6MCE) [Citation99]. In both snapshots, RNA is shown in a cartoon representation (gray), Tat backbone is shown in a tubular representation (yellow), the Cα atoms of those arginine residues which participate in key interactions with both RNA molecules are shown in red spheres, while other arginine residues are shown in blue spheres. The zoomed snapshots correspond to specific interactions formed between the arginine residues in Tat (red sticks) and the RNA nucleotides.](/cms/asset/74d8959c-b96d-498d-9b23-26488137958d/krnb_a_2289709_f0004_oc.jpg)
Figure 5. The G-quadruplex conformation from LTR-3. Two snapshots of a G-quadruplex DNA structure from the LTR-3 along with the sequence of the LTR-3 domain are shown. DNA is depicted in a ribbon representation (gray); guanine, adenine, thymine, and cytosine bases are depicted in cyan, green, orange, and red stick representations, respectively. A pink arrow in the right panel follows the V-shape of the -end loop.
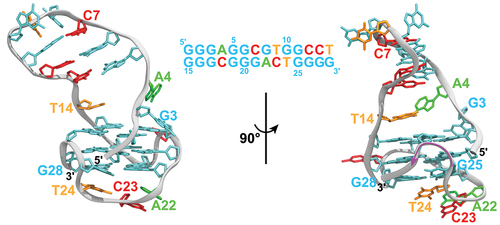
Table 3. Structural data on the HIV-1 RNA elements participating in nuclear export. Data similar to are shown for the HIV-1 RNA elements participating in nuclear export and the following additional abbreviations are used: Rev, regulator of expression of virion; RRE, Rev response element.
Figure 6. RRE-IIB RNA in complex with the helical peptides. Shown are (A) the sequences of the HIV-1 RRE-IIB RNA, the Rev peptide, and the RSG-1.2 peptide with key nucleotides and amino acids highlighted in blue and red, respectively; (B) the snapshots of the HIV-1 RRE-IIB RNA bound to Rev peptide (PDB 1ETF) [Citation124]; and (C) the snapshots of the HIV-1 RRE-2B RNA bound to the RSG-1.2 peptide (PDB 1G70) [Citation127]. In all snapshots, RNA is shown in a cartoon representation (light green) with the blue spheres corresponding to phosphorous atoms for those nucleotides which form crucial interactions with the peptides and with the green spheres corresponding to phosphorous atoms in the backbone of other RNA nucleotides; the peptide backbone is shown in a tubular representation (white) with red spheres corresponding to the atoms of key arginine residues. The snapshots of the entire RNA/peptide complexes are accompanied with snapshots highlighting the corresponding interactions between key arginine amino acids and RNA nucleotides which are represented as red and blue sticks, respectively.
![Figure 6. RRE-IIB RNA in complex with the helical peptides. Shown are (A) the sequences of the HIV-1 RRE-IIB RNA, the Rev peptide, and the RSG-1.2 peptide with key nucleotides and amino acids highlighted in blue and red, respectively; (B) the snapshots of the HIV-1 RRE-IIB RNA bound to Rev peptide (PDB 1ETF) [Citation124]; and (C) the snapshots of the HIV-1 RRE-2B RNA bound to the RSG-1.2 peptide (PDB 1G70) [Citation127]. In all snapshots, RNA is shown in a cartoon representation (light green) with the blue spheres corresponding to phosphorous atoms for those nucleotides which form crucial interactions with the peptides and with the green spheres corresponding to phosphorous atoms in the backbone of other RNA nucleotides; the peptide backbone is shown in a tubular representation (white) with red spheres corresponding to the Cα atoms of key arginine residues. The snapshots of the entire RNA/peptide complexes are accompanied with snapshots highlighting the corresponding interactions between key arginine amino acids and RNA nucleotides which are represented as red and blue sticks, respectively.](/cms/asset/7db24a2f-cd68-4db2-9c99-c98656e29089/krnb_a_2289709_f0006_oc.jpg)
Figure 7. Structural features of the dimerization process. Shown are (A) the scheme and secondary structure of the dimerization process; (B) the snapshot of the overall kissing complex and the zoomed-in view of the kissing loop region (PDB 2D1B) [Citation183]; and (C) the example snapshots of two extended duplexes which display different configurations of the bulged nucleotides (PDBs 462D and 2D1A) [Citation183,Citation185]. The zoomed-in view on one of the bulged motifs is provided for the second extended duplex. In each panel, nucleotides of the DIS kissing loops (G274 to C279) participating in the recognition process are highlighted in darker colors.
![Figure 7. Structural features of the dimerization process. Shown are (A) the scheme and secondary structure of the dimerization process; (B) the snapshot of the overall kissing complex and the zoomed-in view of the kissing loop region (PDB 2D1B) [Citation183]; and (C) the example snapshots of two extended duplexes which display different configurations of the bulged nucleotides (PDBs 462D and 2D1A) [Citation183,Citation185]. The zoomed-in view on one of the bulged motifs is provided for the second extended duplex. In each panel, nucleotides of the DIS kissing loops (G274 to C279) participating in the recognition process are highlighted in darker colors.](/cms/asset/6f2313c0-748c-49f0-ab31-fae9f68104fe/krnb_a_2289709_f0007_oc.jpg)
Table 4. Structural data on the HIV-1 RNA elements participating in the gRNA dimerization. Data similar to are shown for the HIV-1 RNA elements participating in the gRNA dimerization and the following additional abbreviations are used: BM, bulge-out motif; DIS, dimerization initiation site; ED, extended duplex; KL, kissing loop; MD, molecular dynamics simulation; SL, stem-loop. Asterisk (*) indicates structures containing DNA.
Table 5. A summary of simulation studies on the HIV-1 RNA. For each simulation study, listed is the simulated HIV-1 RNA element, corresponding simulation conditions, and the force-field used in RNA simulations. The cumulative simulation time-scale, the temperature, and simulation methods are also listed for each study. The RNA force-fields summarized are CHARMM27 [Citation267], CHARMM36 [Citation268], Cornell et al. [Citation269], parm98 [Citation270], parmbsc0 [Citation271], ff99OL3 [Citation271–273], and RNA.ROC [Citation274]. The missing simulation parameters or force-field details in the table is due to the absence of such information in some simulation studies [Citation258,Citation275–278]. The following abbreviations are used: CG, coarse-grained; DFT, density functional theory; FEP, free energy perturbation; KL, kissing loop; MD, molecular dynamics; MM-GBSA, molecular mechanics with generalized born and surface area solvation; PBE, Poisson–Boltzmann equation; QM, quantum mechanics-based reparameterization of the AMBER force field; RAM, replica-averaged metadynamics; SL1, stem loop 1; SMD, steered molecular dynamics. Furthermore, RNA/DNA indicates the structure containing RNA/DNA hybrid.