799
Views
0
CrossRef citations to date
0
Altmetric
Research Paper

LncRNA USP2-AS1 facilitates the osteogenic differentiation of bone marrow mesenchymal stem cells by targeting KDM3A/ETS1/USP2 to activate the Wnt/β-catenin signaling pathway

, , , , , & show all
Pages 1-13 | Accepted 10 Aug 2023, Published online: 22 Dec 2023

Figures & data

Figure 1. USP2-AS1 promotes the osteogenic differentiation of HBMSCs.(A) Data from GEO database (GSE113359) showed differentially expressed lncRnas in HBMSCs on day 0 and day 10 during osteogenic differentiation. (B) RT-qPCR detected the expression levels of the selected lncRnas in PM-HBMSCs and OM-HBMSCs. (C) RT-qPCR detected the expression of USP2-AS1 in OM-HBMSCs on day 0, 5, 10 and 15 of osteogenic differentiation. (D) ALP staining assay examined the influence of USP2-AS1 silencing on ALP activity of OM-HBMSCs. (E) ARS staining assay verified the effect of USP2-AS1 knockdown on the formation of mineralized bone matrix in OM-HBMSCs. (F-G) RT-qPCR and western blot analysed the expression levels of osteogenesis-associated markers in USP2-AS1-depleted OM-HBMSCs. (H) subcellular fractionation and FISH assays determined the distribution of USP2-AS1 in OM-HBMSCs. **P < 0.01.
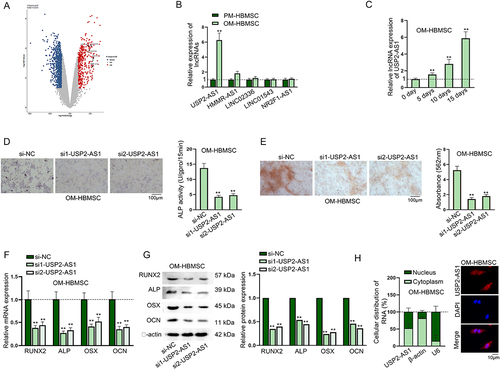
Figure 1. USP2-AS1 promotes the osteogenic differentiation of HBMSCs.(A) Data from GEO database (GSE113359) showed differentially expressed lncRnas in HBMSCs on day 0 and day 10 during osteogenic differentiation. (B) RT-qPCR detected the expression levels of the selected lncRnas in PM-HBMSCs and OM-HBMSCs. (C) RT-qPCR detected the expression of USP2-AS1 in OM-HBMSCs on day 0, 5, 10 and 15 of osteogenic differentiation. (D) ALP staining assay examined the influence of USP2-AS1 silencing on ALP activity of OM-HBMSCs. (E) ARS staining assay verified the effect of USP2-AS1 knockdown on the formation of mineralized bone matrix in OM-HBMSCs. (F-G) RT-qPCR and western blot analysed the expression levels of osteogenesis-associated markers in USP2-AS1-depleted OM-HBMSCs. (H) subcellular fractionation and FISH assays determined the distribution of USP2-AS1 in OM-HBMSCs. **P < 0.01.

Figure 2. USP2-AS1 induces the osteogenic differentiation of HBMSCs by up-regulating USP2.(A) FISH assay detected the co-localization of USP2-AS1 and USP2 in OM-HBMSCs. The genomic location of USP2-AS1 and USP2 obtained from UCSC was shown. (B) Based on RT-qPCR results of USP2-AS1 and USP2 expressions on day 0, 5, 10 and 15 after osteogenic differentiation, correlation analysis was completed. (C) RT-qPCR and western blot confirmed the effect of USP2-AS1 silencing on USP2 expression in OM-HBMSCs 14 days after osteogenic induction. (D) ALP staining examined the influence of USP2-AS1 depletion and USP2 overexpression on the ALP activity of OM-HBMSCs 14 days after cultivation. (E) ARS staining assay explored the role of USP2-AS1 and USP2 in the formation of mineralized bone matrix in OM-HBMSCs 14 days after cultivation. (F-G) RT-qPCR and western blot measured the expression levels of RUNX2, ALP, OSX and OCN in OM-HBMSCs with different transfection. (H) luciferase reporter assays verified the influence of USP2-AS1 overexpression on the activity of USP2 promoter. **P < 0.01.
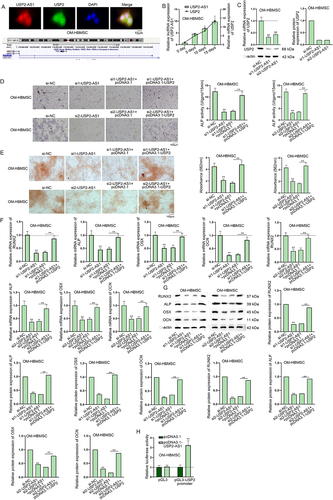
Figure 2. USP2-AS1 induces the osteogenic differentiation of HBMSCs by up-regulating USP2.(A) FISH assay detected the co-localization of USP2-AS1 and USP2 in OM-HBMSCs. The genomic location of USP2-AS1 and USP2 obtained from UCSC was shown. (B) Based on RT-qPCR results of USP2-AS1 and USP2 expressions on day 0, 5, 10 and 15 after osteogenic differentiation, correlation analysis was completed. (C) RT-qPCR and western blot confirmed the effect of USP2-AS1 silencing on USP2 expression in OM-HBMSCs 14 days after osteogenic induction. (D) ALP staining examined the influence of USP2-AS1 depletion and USP2 overexpression on the ALP activity of OM-HBMSCs 14 days after cultivation. (E) ARS staining assay explored the role of USP2-AS1 and USP2 in the formation of mineralized bone matrix in OM-HBMSCs 14 days after cultivation. (F-G) RT-qPCR and western blot measured the expression levels of RUNX2, ALP, OSX and OCN in OM-HBMSCs with different transfection. (H) luciferase reporter assays verified the influence of USP2-AS1 overexpression on the activity of USP2 promoter. **P < 0.01.

Figure 3. ETS1 transcriptionally activates USP2. (A) According to the data from hTftarget, transcription factors with potential to bind to USP2 were predicted. (B) RT-qPCR assay measured USP2 expression in OM-HBMSCs with knockdown of different transcription factors. (C) Western blot assay analysed the expression of USP2 in OM-HBMSCs with or without ETS1 knockdown. (D-E) ChIP and DNA pull-down assays verified the binding between ETS1 and USP2 promoter. (F) JASPAR predicted the binding sequences of ETS1 on USP2 promoter. (G) Schematic representation of ETS1 binding sites on USP2 promoter as well as mutated binding sites was presented, and luciferase reporter assay determined the specific binding sites between ETS1 and USP2 promoter. **P < 0.01.
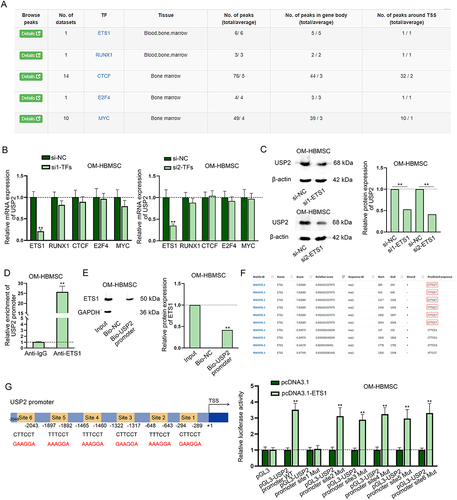
Figure 3. ETS1 transcriptionally activates USP2. (A) According to the data from hTftarget, transcription factors with potential to bind to USP2 were predicted. (B) RT-qPCR assay measured USP2 expression in OM-HBMSCs with knockdown of different transcription factors. (C) Western blot assay analysed the expression of USP2 in OM-HBMSCs with or without ETS1 knockdown. (D-E) ChIP and DNA pull-down assays verified the binding between ETS1 and USP2 promoter. (F) JASPAR predicted the binding sequences of ETS1 on USP2 promoter. (G) Schematic representation of ETS1 binding sites on USP2 promoter as well as mutated binding sites was presented, and luciferase reporter assay determined the specific binding sites between ETS1 and USP2 promoter. **P < 0.01.

Figure 4. ETS1 up-regulates USP2 to promote the osteogenic differentiation of HBMSCs.Experiments were carried out with OM-HBMSCs (14 days after osteogenic differentiation) with transfection of si-NC, si1-ETS1, si1-ETS1+pcDNA3.1 or si1-ETS1+pcDNA3.1-USP2. (A-B) ALP staining assay and ARS staining assay examined the influence of ETS1 knockdown and USP2 augment on the ALP activity and formation of mineralized bone matrix of OM-HBMSCs. (C-D) RT-qPCR and western blot detected RUNX2, ALP, OSX and OCN levels in OM-HBMSCs. **P < 0.01.
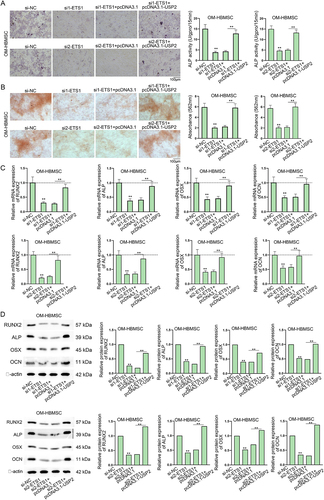
Figure 4. ETS1 up-regulates USP2 to promote the osteogenic differentiation of HBMSCs.Experiments were carried out with OM-HBMSCs (14 days after osteogenic differentiation) with transfection of si-NC, si1-ETS1, si1-ETS1+pcDNA3.1 or si1-ETS1+pcDNA3.1-USP2. (A-B) ALP staining assay and ARS staining assay examined the influence of ETS1 knockdown and USP2 augment on the ALP activity and formation of mineralized bone matrix of OM-HBMSCs. (C-D) RT-qPCR and western blot detected RUNX2, ALP, OSX and OCN levels in OM-HBMSCs. **P < 0.01.

Figure 5. USP2-AS1 up-regulates ETS1 via recruiting KDM3A.(A) The binding potential between USP2-AS1 and ETS1 was predicted on RPISeq website. (B) In RIP assay, RT-qPCR analysed the enrichment of USP2-AS1 in Anti-IgG and Anti-ETS1 in OM-HBMSCs. (C-D) RT-qPCR detected ETS1 expression upon USP2-AS1 silencing and KDM3A knockdown in OM-HBMSCs. (E) RPISeq website predicted the binding potential between USP2-AS1 and KDM3A. (F) FISH-IF assays determined the co-localization of USP2-AS1 and KDM3A in OM-HBMSCs. (G-H) RIP and RNA pull-down assays confirmed the binding relationship between USP2-AS1 and KDM3A. (I) RT-qPCR assay verified the influence of KDM3A depletion and USP2-AS1 overexpression on the expression of ETS1. (J) western blot detected protein levels of ETS1 and H3K9me2 in KDM3A-silenced OM-HBMSCs. (K) ChIP assay analysed the interaction between H3K9me2 and ETS1 promoter in OM-HBMSCs with or without KDM3A deficiency. (L-M) RT-qPCR and western blot quantified USP2 expression in OM-HBMSCs with different transfection. **P < 0.01; n.S.: no significance.
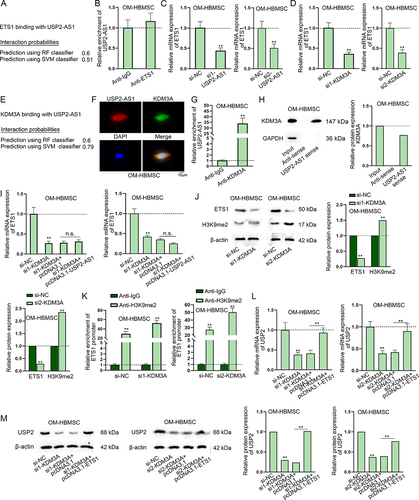
Figure 5. USP2-AS1 up-regulates ETS1 via recruiting KDM3A.(A) The binding potential between USP2-AS1 and ETS1 was predicted on RPISeq website. (B) In RIP assay, RT-qPCR analysed the enrichment of USP2-AS1 in Anti-IgG and Anti-ETS1 in OM-HBMSCs. (C-D) RT-qPCR detected ETS1 expression upon USP2-AS1 silencing and KDM3A knockdown in OM-HBMSCs. (E) RPISeq website predicted the binding potential between USP2-AS1 and KDM3A. (F) FISH-IF assays determined the co-localization of USP2-AS1 and KDM3A in OM-HBMSCs. (G-H) RIP and RNA pull-down assays confirmed the binding relationship between USP2-AS1 and KDM3A. (I) RT-qPCR assay verified the influence of KDM3A depletion and USP2-AS1 overexpression on the expression of ETS1. (J) western blot detected protein levels of ETS1 and H3K9me2 in KDM3A-silenced OM-HBMSCs. (K) ChIP assay analysed the interaction between H3K9me2 and ETS1 promoter in OM-HBMSCs with or without KDM3A deficiency. (L-M) RT-qPCR and western blot quantified USP2 expression in OM-HBMSCs with different transfection. **P < 0.01; n.S.: no significance.

Figure 6. USP2 stabilizes β-catenin protein to activate the Wnt/β-catenin signalling pathway.(A) Interacting proteins of USP2 were predicted on BioGRID database. (B) GST pull-down assay verified the interaction between USP2 and β-catenin. (C) CoIP assay further verified the interaction between USP2 and β-catenin. (D) western blot assay verified the influence of USP2 depletion on the ubiquitination of β-catenin. (E-F) western blot detected the impact of USP2 depletion on the protein level and stability of β-catenin. (G) TOP/FOP flash assay assessed the influence of USP2 on Wnt/β-catenin signalling pathway. **P < 0.01.
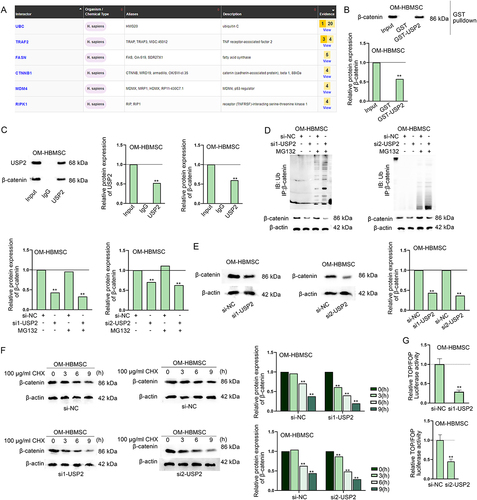
Figure 6. USP2 stabilizes β-catenin protein to activate the Wnt/β-catenin signalling pathway.(A) Interacting proteins of USP2 were predicted on BioGRID database. (B) GST pull-down assay verified the interaction between USP2 and β-catenin. (C) CoIP assay further verified the interaction between USP2 and β-catenin. (D) western blot assay verified the influence of USP2 depletion on the ubiquitination of β-catenin. (E-F) western blot detected the impact of USP2 depletion on the protein level and stability of β-catenin. (G) TOP/FOP flash assay assessed the influence of USP2 on Wnt/β-catenin signalling pathway. **P < 0.01.
Supplemental material

Supplementary file 3.tif

Download TIFF Image (1.9 MB)

Supplementary file 1.xlsx

Download MS Excel (13.5 KB)

Supplementary file 7.tif

Download TIFF Image (11.6 MB)

Supplementary file 2.tif

Download TIFF Image (1.8 MB)

Supplementary file 5.tif

Download TIFF Image (2.2 MB)

Supplementary file 4.tif

Download TIFF Image (1.3 MB)

Supplementary file 6.tif

Download TIFF Image (14.3 MB)