
Figures & data
Figure 1. Distribution of RNA variants in four GTEx tissues.
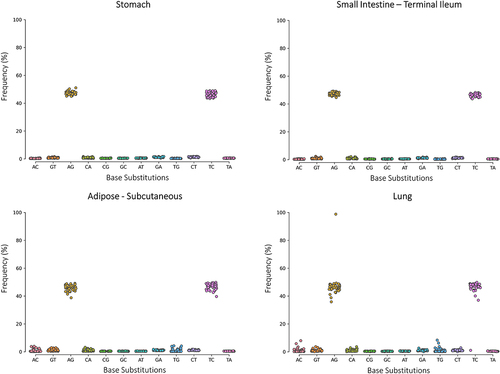
Figure 2. Snapshot of a ±3 region surrounding the known editing site chr2:121983221 of the B2m gene. A graphical representation of the frequencies of aligned bases along with deletions and insertions. Data were retrieved from both KO (on the top) and WT (on the bottom) from Illumina (a, c) and ONT (b, d) runs.
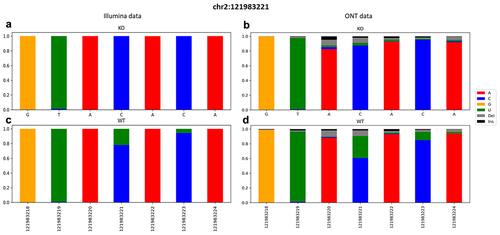
Figure 3. Average alignment profile of Illumina ‘ground-truth’ sites putatively related to the APOBEC1 enzyme signature (U bases are shown here as T).
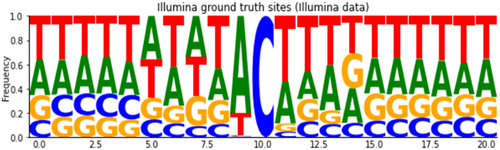
Figure 4. a) Pairplot of the principal component analysis summarizing basecalling features (central U base quality, mean quality, mismatches, insertion and deletion count) extracted from Illumina ‘ground-truth’ sites of WT (blue) and KO (orange) CU-context reads. The first three components explain more than 80% of the total variance of the data. b) Pairplot describing CU context reads retrieved from Illumina ‘ground-truth’ sites of both WT (blue dots) and KO (orange dots) ONT runs. A total of five features are shown: T_qual is the quality of the uridine central base; mean_qual is the average quality of bases on an interval of ±3 nucleotides; mism_count is the number of mismatches with respect to the reference expected bases on the same interval; ins_count and del_count are the total numbers of insertions and deletions within the interval, respectively.
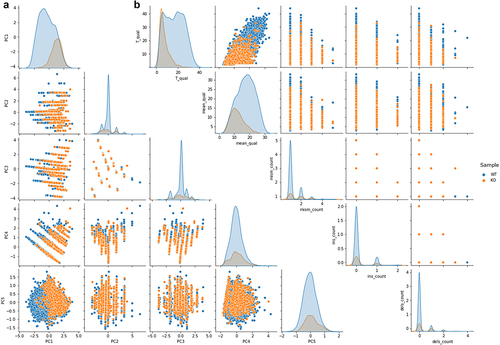
Figure 5. Dimensionality reduction by t-SNE of basecalling features (central U base quality, mean quality, mismatches, insertion and deletion count) extracted from Illumina ‘ground-truth’ sites of WT (blue) and KO (orange) CU-context reads.
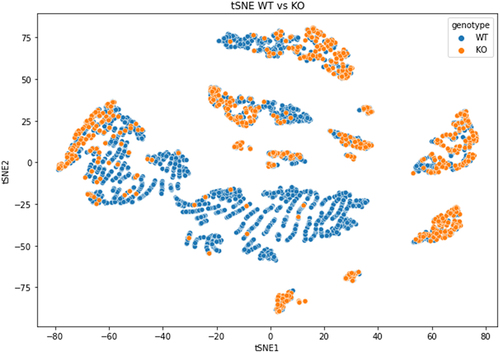
Figure 6. Analysis of the ionic current features for the site chr2:121983221 residing in the 3’UTR of the mouse B2m gene locus. (a) and (b) are shown the distributions of C and U currents for WT and KO samples, respectively. (c) is reported the distribution of U currents only from WT and KO samples, while (d) is depicted the same distribution for C currents only. PCA of current features (intervals of ±2 nucleotides) for WT and KO samples are shown in (e) and (f), respectively. Each dot in PCA graphs represents an aligned C (blue) or a U (red).
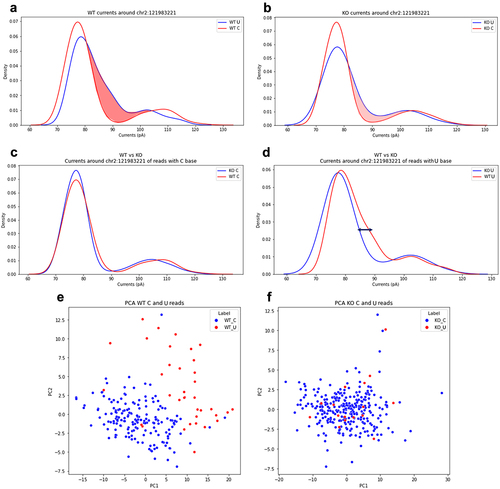
Figure 7. PCA analysis of ionic current features extracted from synthetic constructs dataset. Each dot in PCA graphs represents an aligned C (blue) or a U (orange).
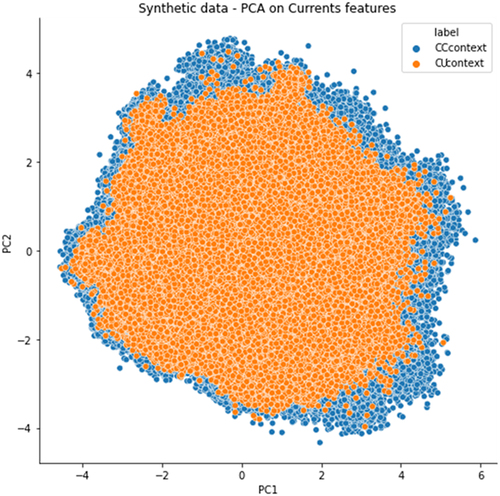
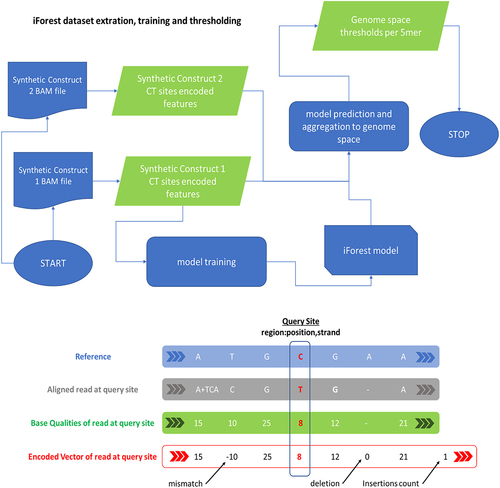
Figure 8. iForest model for the training, validation, testing, and prediction of C-to-U editing events at the “per-read” level and then, after the aggregation step on the “genome-space” level. On the top, the workflow used for the training of the model, starting from encoded base-calling features. On the bottom, schematization of the encoding strategy used to compress base-calling feature information that is provided to the model.
Supplementary Table1.pdf
Download PDF (695.8 KB)Supplementary Table2.pdf
Download PDF (56.8 KB)Supplementary Table captions.docx
Download MS Word (12.3 KB)Supplementary Figures.docx
Download MS Word (1.2 MB)Supplementary Figure Captions.docx
Download MS Word (14.7 KB)Data availability statement
Illumina and Nanopore raw reads from mouse cells have been submitted to the SRA database under the BioProject PRJNA949094. Illumina and Nanopore raw reads from human cells, instead, are available under the accession PRJNA1050198. The Python code implementing the above described methodology, as well as the accessory jupyter notebooks used for data analysis, are available at the GitHub repository: https://github.com/F0nz0/C_to_U_classifier