Figures & data
Figure 1. PAT-Seq uncovers widespread switching to distal cleavage sites after EMT and proximal sites after QKI knockdown. (A) MA plots for mesHMLE vs HMLE with APA effect size plotted against average expression across samples. (B) MA plot for mesHMLE vs mesHMLE + QKI knockdown. A positive effect size value indicates a shift to distal cleavage site usage, while a negative value indicates a shift to proximal sites. Blue dots indicate no significant change in APA, black dots indicate a significant change in APA and red dots indicate a significant change in APA and a QKI CLIP-Seq peak present in the 3’UTR of that transcript (in at least 3 QKI CLIP-Seq replicates). (C) The most enriched motif in the mesHMLE HITS-CLIP as determined by the software package HOMER. (D) Pie chart showing the distribution of QKI CLIP-Seq peaks by genomic location type. (E) Volcano plot of enriched GO terms from the set of 443 transcripts bound by QKI in at least 4 out of 7 separate CLIP-Seq experiments. Dot colour and size represents number of overlapping genes for that category. (F) Pie chart depicting the proportion of QKI 3’UTR targets with the QKI-CLIP peak centre within 100 nucleotides of an annotated cleavage site from the Poly A site atlas.
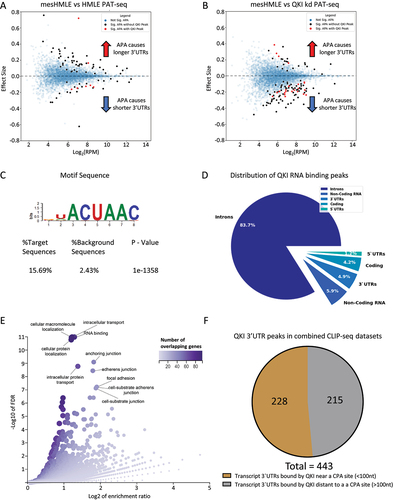
Figure 2. QKI 3’UTR binding often occurs near cleavage and polyadenylation sites. (A) Heat map comparison of QKI regulated APA events with QKI CLIP-seq datasets to identify APA events directly regulated by QKI. Genes with APA events and evidence of QKI binding in at least 3 QKI CLIP-seq datasets are indicated (n = 24). Where QKI binding sites are located within 100nt window either side of the APA site these are highlighted in bold. (B) Bar chart of enriched GO terms in the set of 24 genes. (C) Images of IGV tracks depicting change in cleavage site usage for selected genes. Individual tracks show depth-normalized coverage of each replicate PAT-Seq sample for HMLE, mesHMLE and mesHMLE + QKI knockdown. (D) Graphs showing the change in APA site usage for selected genes in HMLE (n = 4), mesHMLE (n = 3), mesHMLE + QKI-5 knockdown (n = 3) and mesHMLE + QKI-5 overexpression (n = 3), as determined by qRT-PCRs. For WDFY3 and COMT, proximal cleavage primers detect proximal and distal APA and are a measure of total mRNA. Error bars indicate standard deviation of the mean. Statistical significance determined by performing a one-way ANOVA (F-value and p-value indicated) followed by Sidak’s multiple comparison post-hoc test. *p < 0.05, **p < 0.01, ***p < 0.001. (E) Western blot of QKI-5 and Tubulin expression in representative samples from (D). (F) Scatter plot showing the ratio of the Long to short 3’UTR transcripts against total QKI mRNA in the Cancer Cell Line Encyclopedia breast cancer samples [Citation35]. Line represents a linear regression model and the shaded area represents the confidence interval. Pearson correlation coefficients and associated p-values are shown with p-values <0.05 highlighted in red.
![Figure 2. QKI 3’UTR binding often occurs near cleavage and polyadenylation sites. (A) Heat map comparison of QKI regulated APA events with QKI CLIP-seq datasets to identify APA events directly regulated by QKI. Genes with APA events and evidence of QKI binding in at least 3 QKI CLIP-seq datasets are indicated (n = 24). Where QKI binding sites are located within 100nt window either side of the APA site these are highlighted in bold. (B) Bar chart of enriched GO terms in the set of 24 genes. (C) Images of IGV tracks depicting change in cleavage site usage for selected genes. Individual tracks show depth-normalized coverage of each replicate PAT-Seq sample for HMLE, mesHMLE and mesHMLE + QKI knockdown. (D) Graphs showing the change in APA site usage for selected genes in HMLE (n = 4), mesHMLE (n = 3), mesHMLE + QKI-5 knockdown (n = 3) and mesHMLE + QKI-5 overexpression (n = 3), as determined by qRT-PCRs. For WDFY3 and COMT, proximal cleavage primers detect proximal and distal APA and are a measure of total mRNA. Error bars indicate standard deviation of the mean. Statistical significance determined by performing a one-way ANOVA (F-value and p-value indicated) followed by Sidak’s multiple comparison post-hoc test. *p < 0.05, **p < 0.01, ***p < 0.001. (E) Western blot of QKI-5 and Tubulin expression in representative samples from (D). (F) Scatter plot showing the ratio of the Long to short 3’UTR transcripts against total QKI mRNA in the Cancer Cell Line Encyclopedia breast cancer samples [Citation35]. Line represents a linear regression model and the shaded area represents the confidence interval. Pearson correlation coefficients and associated p-values are shown with p-values <0.05 highlighted in red.](/cms/asset/4b63a064-0fed-4c18-a703-c0bc0bb5cf2f/krnb_a_2294222_f0002_oc.jpg)
Figure 3. QKI-5 regulates its own APA to produce a transcript with a long 3’UTR. (A) IGV tracks depicting the location of QKI CLIP-Seq peaks in the QKI-5 3’UTR. (B) The nucleotide sequence around the predominant site of QKI binding in the QKI-5 3’UTR showing potential QKI binding and PAS sites. (C-E) Bar charts depicting the ratio of the isoform that uses the distal cleavage site to the isoform that uses the proximal cleavage sites for indicated genes determined by qRT-PCRs performed on mesHMLE, mesHMLE QKI knockout and mesHMLE QKI Knockout + inducible QKI-5, with and without 1 µg/mL doxycycline (Dox) treatment (n = 1), (G-I) and PC3-eLuc-GFP, PC3-eLuc-GFP QKI knockout and PC3-eLuc-GFP QKI knockout + inducible QKI-5 (n = 1). (F & J) Western blots of QKI and Tubulin protein performed on matched protein samples for (C-E & G-I).
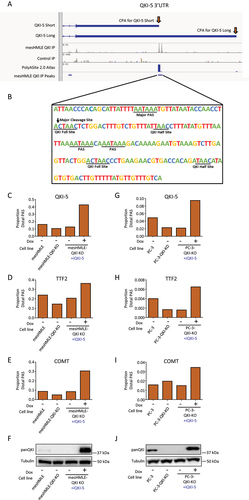
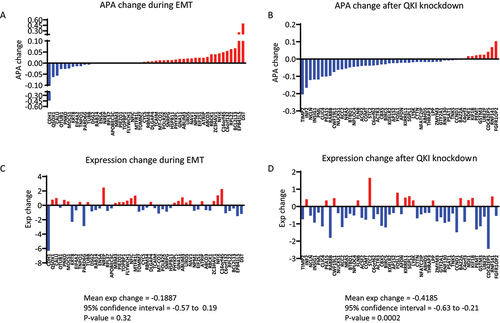
Figure 4. Correlation of APA changes with gene expression changed during EMT and following QKI knockdown. (A-B) Changes in APA during EMT of HMLE cells or following QKI knockdown in mesHMLE cells, aligned from most shortened to most lengthened 3’UTR. Only the top 50 differentially expressed genes with significant changes in APA (FDR <0.05) are represented (C-D) Corresponding changes in gene expression for APA affected genes. Blue bars indicate decreased APA and gene expression, and red bars indicate increased APA and gene expression. Statistical significance was measured using a one sample t-test on differentially expressed genes with significant APA change with mean expression change, confidence interval, and p-values shown.