Figures & data
Figure 1. Progressive advent of wobble coding. Mean fraction of environmental codon assignments utilizing simple Crick wobble instead of standard base pairing is plotted versus time in passages. Plots cover times discussed in the text, for pwob = 0.0 (brown), 0.0004 (red), 0.001 (blue), 0.005 (green) and 0.02 (orange) per passage. Other probabilities have standard values: pmut (related assignment [Citation12,Citation13] to unused neighbour) = 0.00975, Pdecay (loss of assignment) = 0.00975, Pinit (initial assignment) = 0.15, Prand (random assignment) = 0.05, pfus (code fusion) = 0.002, Ptab (new code arises with one assignment) = 0.08 per passage.
![Figure 1. Progressive advent of wobble coding. Mean fraction of environmental codon assignments utilizing simple Crick wobble instead of standard base pairing is plotted versus time in passages. Plots cover times discussed in the text, for pwob = 0.0 (brown), 0.0004 (red), 0.001 (blue), 0.005 (green) and 0.02 (orange) per passage. Other probabilities have standard values: pmut (related assignment [Citation12,Citation13] to unused neighbour) = 0.00975, Pdecay (loss of assignment) = 0.00975, Pinit (initial assignment) = 0.15, Prand (random assignment) = 0.05, pfus (code fusion) = 0.002, Ptab (new code arises with one assignment) = 0.08 per passage.](/cms/asset/6754651d-8fcc-4cc0-9dbb-b3e6faae6c5e/krnb_a_2299615_f0001_oc.jpg)
Figure 2. Early wobble appearance delays complete coding. Pwob (as in fig. 1) is plotted versus mean time (in passages, for 100 environments) to evolve the first code with ≥ 20 assigned functions in an environment. System constants are those listed in fig. 1. Error bars are standard errors of means.
Figure 3. Early wobble obstructs complete coding. Fraction of active codes in 1000 environments that have ≥ 20 assigned functions vs time in passages, for pwob = 0.0 (nowob, squares) and pwob = 0.02 (wob, circles). except for pwob, probabilities/passage are those in fig. 1. Error bars are standard errors.
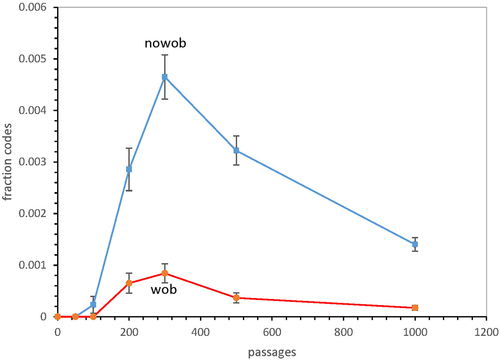
Figure 4. Early wobble specifically disrupts fusion to more complete, SGC-like codes. A – fused and unfused active codes are distinct. Mean environmental frequencies versus number of encoded functions in 1000 environments after 300 passages. Pwob = 0.0, and other probabilities/passage as in fig. 1. Unfused codes (unfus) are red, successful fusions (fused) are grey, and total active codes (sum of unfused and active fusions) are blue. B – frequencies of fused and unfused (labelled nofus) active codes versus number of assignments, with (labelled wob, solid lines, pwob = 0.02) and without (labelled nowob, dashed lines, pwob = 0.0) wobble. From 1000 environments after 200 passages; other probabilities as in fig. 1. C – frequencies of fused and unfused active codes versus number of assignments, with (marked wob, solid lines, pwob = 0.02) and without (marked nowob, dashed lines, pwob = 0.0) wobble. From 1000 environments after 300 passages; other probabilities as in fig. 1. Horizontal arrows mark codes altered by wobble (≥15 encoded functions) and closest to the SGC (≥20 encoded functions). D – frequencies of fused and unfused (labelled nofus) active codes versus number of assignments, with (solid lines, pwob = 0.02) and without (dashed lines, pwob = 0.0) wobble. From 1000 environments after 500 passages; other probabilities as in fig. 1.
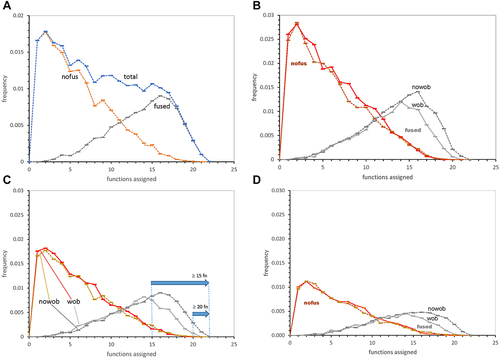
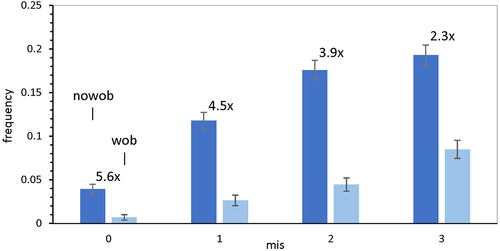
Figure 5. The most complete codes in 1000 environments at 300 passages with (wob) and without wobble (nowob), have different accuracies. Frequency among active codes of the most accurate coding (0, 1, 2 or 3 misassignments – mis0, 1, 2 or 3, respectively), with (pwob = 0.02) and without (pwob = 0.0) early wobble. Numbers (e.g. 5.6×) are frequencies for non-wobbling codes divided by frequencies of codes with wobble. Error bars are standard errors for plotted frequencies. Environmental events, save for pwob, have the probabilities in fig. 1.