Figures & data
Table 1. The m6A and m6Am regulators.
Table 2. Characteristics of the fasting model.
Figure 1. Effect of fasting on plasma metabolites measured by a multiplatform LC-MS-based approach (A) PCA (principal component analysis) showing a clear separation between fasting and control rat plasma samples, suggesting distinct metabolomic profiles associated with the fasting state (B) volcano plot of all (677) metabolites indicating differential levels of metabolites in plasma samples of fasting and control rats (C) heat map of the 50 most significantly affected metabolites; n = 7.
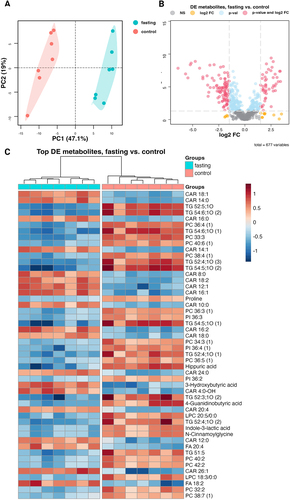
Figure 2. Effect of 3-day fasting on gene expressions of m6A and m6Am regulators in the left ventricle assessed by RT-qPCR. Writers are displayed in blue, erasers in red, and readers in yellow. The average of the control values is set to 1. Values are means ± SD; n = 6–8; *p < 0.05; **p < 0.01 (t-test). Alkbh5 – AlkB family member 5; Fto – fat mass and obesity-associated; Mettl3 – methyltransferase-like 3; Mettl4 – methyltransferase-like 4; Pcif1 – phosphorylated CTD interacting factor 1; Ythdf1–3 – YTH domain-containing family protein 1–3; Ythdc1–2 – YTH domain-containing protein 1–2.
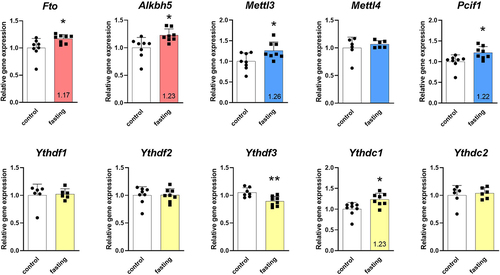
Figure 3. Effect of 3-day fasting on protein levels of m6A and m6Am regulators in the left ventricles assessed by Western blot (A). Writers are displayed in blue, erasers in red, and readers in yellow. The average of the control values is set to 1. Representative Western blot membranes (B). Protein loadings were 40 μg (YTHDF1, YTHDF3), 30 μg (YTHDC1), 20 μg (FTO, ALKBH5, YTHDC2), 15 μg (METTL3, YTHDF2), and 10 μg (METTL4, PCIF1). Values are means ± SD; n = 8; *p < 0.05; **p < 0.01; ***p < 0.001 (t-test). ALKBH5 – AlkB family member 5; C – control; F – fasting; FTO – fat mass and obesity-associated protein; METTL3 – methyltransferase-like 3; METTL4 – methyltransferase-like 4; PCIF1 – phosphorylated CTD interacting factor 1; YTHDF1–3 – YTH domain-containing family protein 1–3; YTHDC1–2 – YTH domain-containing protein 1–2.
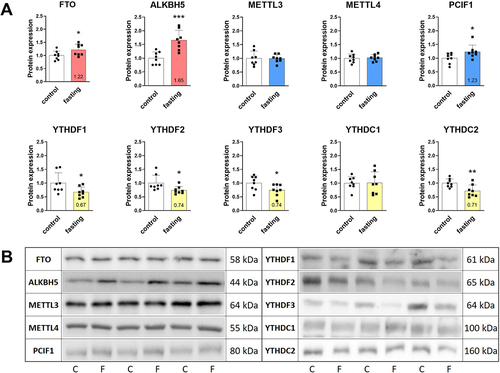
Table 3. Targeted proteomic analysis – changes in peptide levels.
Figure 4. Levels of epitranscriptomic regulators in left ventricles of fasting rats assessed by RT-qPCR, Western blot, and proteomic analysis. Out of the two peptides measured for each protein in proteomic analyses, the peptide with more profound changes was depicted. ALKBH5 – AlkB family member 5; FTO – fat mass and obesity-associated protein; METTL3 – methyltransferase-like 3; METTL4 – methyltransferase-like 4; PCIF1 – phosphorylated CTD interacting factor 1; YTHDF1–3 – YTH domain-containing family protein 1–3; YTHDC1–2 – YTH domain-containing protein 1–2.
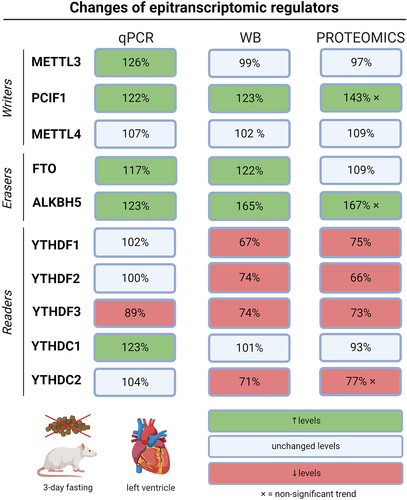
Figure 5. The difference between m6A/m methylation levels in total RNA from left ventricles of fasting rats. Values are means ± SD; n = 7–8; * p < 0.05 (t-test).
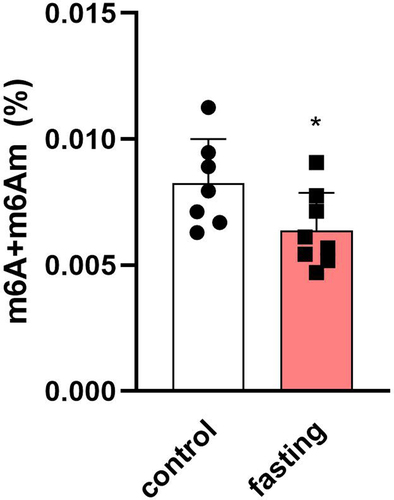
Figure 6. The m6A/m enrichment in specific mRnas isolated from left ventricles of fasting rats. The average of the control values is set to 1. Values are means ± SD; n = 3; ** p < 0.01 (t-test). Nfe2l2 – NFE2 like BZIP transcription factor 2; Sirt1 – sirtuin 1; Sirt3 – sirtuin 3; Prkaa2 – protein kinase AMP-activated catalytic subunit alpha 2; Rela – RELA proto-oncogene, NF-KB Subunit; Nox4 – NADPH oxidase 4; Hdac1 – histone deacetylase 1; Foxo3 – forkhead box O3; Hif1a – hypoxia inducible factor 1 subunit alpha.
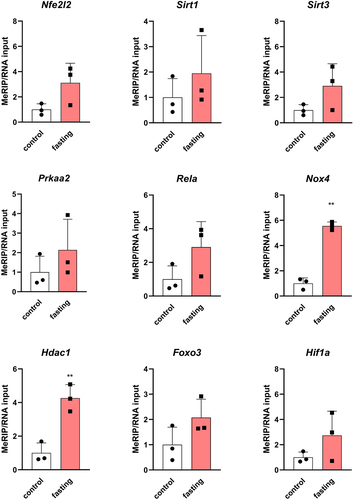
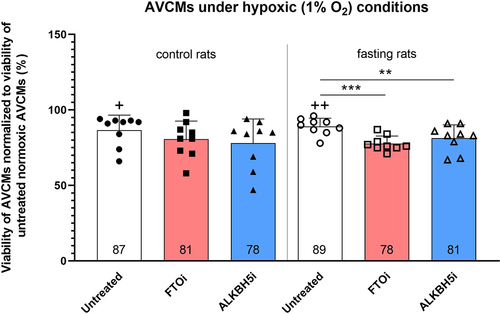
Figure 7. Effect of ALKBH5 and FTO inhibition on hypoxic tolerance of AVCMs isolated from control and fasting rats. Values are means ± SD; n = 9; ** p < 0.01; *** p < 0.001 (one-way ANOVA); + p < 0.05 compared to normoxic untreated AVCMs; ++ p < 0.01 compared to normoxic untreated AVCMs. ALKBH5i – ALKBH5 inhibitor; AVCMs – adult rat left ventricular cardiomyocytes; FTOi – FTO inhibitor.