
Figures & data
Figure 1. PAR-CLIP analysis identified RNA-binding proteins directly binding with mature and precursor miRnas. (A–C) Genome coordinates (y-axis) of precursor and mature miRNA let-7a-1 (A), 7b (B), and 7c (C) identified from PAR-CLIP using human cell lines. T-to-C conversion ratio was presented in y-axis as well. Representative RBPs such as QKI, HuR, hnRNPD/AUF1 and IGF2BP were highlighted.
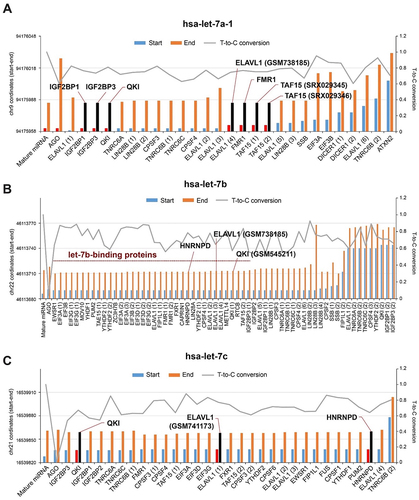
Figure 2. Existence of AGO-free mature miRnas in human and mouse cells. (A) Schematic of experimental set up to profile mature miRNAs from AGO-depleted human and mouse cell lysates. HeLa or MEF lysates were immunoprecipitated using anti-AGO2 or anti-Pan AGO antibodies serially. The resulting pellets and lysates were subjected to RNA purification followed by high throughput RNA-sequencing or RT-qPCR. (B) Western blot analysis of AGO2, QKI and ACTB using cell lysates before and after serial immunoprecipitation.(C, D) RNA-seq analysis of let-7, miR-21 and miR-130b using cell lysates before and after immunoprecipitation with anti-AGO2 or anti-Pan AGO antibodies. N = 2–4, n.d., not detected from RNA-seq, ***p < 0.001, **p < 0.01, *p < 0.05, n.s., not significant from Student’s t-test. Data are mean±S.D. (E) Western blot analysis of AGO2, Pan-AGO, DICER, QKI and ACTB using cell lysates HCT116 cells targeting AGO1, 2, and 3. RNA-seq analysis of let-7, miR-21, miR-130b, and miR-100 using HCT116 wild type and AGO TKO cells. N = 2, ***p < 0.001, *p < 0.05, n.s., not significant from Student’s t-test. Data are mean ± S.D.(F) Scatter plots of miRNAs sequenced from HCT116 wild type and AGO TKO cells. (G) Counting of let-7b from 2 ng total RNA purified from HCT116 wild type and AGO TKO cells. N = 6, n.s., not significant from Student’s t-test. Data are mean ± S.D.
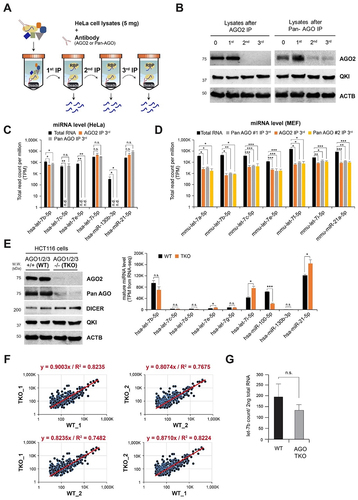
Figure 3. QKI is required for AGO2 interaction with let-7b and allows let-7b loading onto AGO2. (A) A model of QKI’s effect on interaction of AGO2 and let-7b in human cells. (B) AGO2 RIP assay in HeLa cells after transfection of control and QKI shRNA. (Left) At 48 hours after transfection of shRNA targeting GFP or QKI in HeLa cells, cell lysates were subjected to immunoprecipitation against AGO2 for detection of co-purified let-7b by RT-qPCR. (Middle) At 48 hours after transfection of shRNA targeting GFP or QKI in HeLa cells, total RNAs were purified for detection of let-7b by RT-qPCR. (Right) Efficiency of QKI shRNA was determined by western blot of total cell lysates with anti-QKI or anti-ACTB antibodies. N = 3, **p < 0.01, n.s., not significant from Student’s t-test. Data are mean±S.D. Data are mean ± S.D. (C) A model of QKI’s effect on let-7b loading on AGO2 in single molecule analysis. (D) Single-molecule experimental scheme for let-7b (guide RNA) loading on AGO2. Recombinant AGO2 was immobilized on PEG-passivated surface using avidin–biotin interaction and anti-His tag antibody in a detection chamber. Cy5-labelled let-7b was injected into the chamber with or without QKI during the imaging. (E) Histograms of let-7b loading times in (Left) absence or (Right) presence of recombinant OKI. The red lines are single exponential decay fit (27 s and 130 s, respectively). (F) Single exponential fit was performed for loading time distributions. Loading rates of let-7b onto immobilized AGO2 with or without QKI. About 300–500 loading events were observed per experiment. N = 3, **p < 0.01, from Student’s t-test. Data are mean ± S.D. (G) Cy5-labelled let-7b spots on slides with or without immobilized AGO2 and QKI 5 minutes after let-7b injection. The results of single-molecule assay. (H) Recombinant QKI and AGO2 were visualized by Coomassie Blue staining and let-7b is imaged by ethidium bromide staining. The abundance of let-7b was assessed by reverse transcriptase PCR analysis.
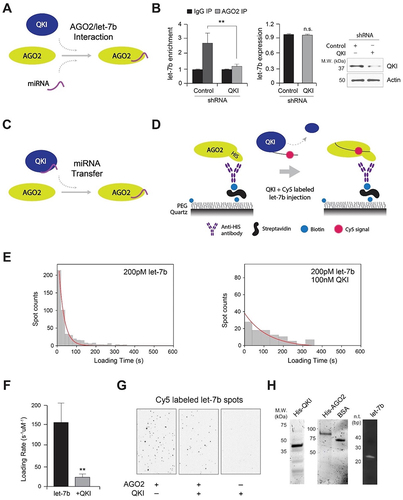
Figure 4. QKI is essential for let-7b-mediated mRNA decay. (A) AGO2 RIP assay was performed in HeLa cells after transfection of control and QKI shRNA for detection of POLR2D mRNA. (Left) After AGO2 RIP, the amount of POLR2D mRNA (a let-7b target mRNA) from immune pellets were determined by reverse transcription (RT) and qPCR, with normalization to TUBA mRNA. (Right) Total RNAs were extracted from control and QKI shRNA cells for RT- qPCR. N = 3, **p < 0.01, *p < 0.05, n.s., not significant from Student’s t-test. Data are mean ± S.D.(B) AGO2 RIP samples were subjected to SDS-PAGE for western blot analysis against AGO2, QKI and ACTB. (C) Measurement of POLR2D and GAPDH mRNA stability with Actinomycin D treatment after transfection of control or QKI shRNA in HeLa cells. At a given time of Actinomycin D treatment, total RNA was purified and converted into cDNA for quantitation of POLR2D, GAPDH mRNA, or 18S RNA. The stability of (Left) POLR2D and (Right) GAPDH mRNAs were determined by comparing the remaining amounts of mRNA to the pre-treatment levels, which were normalized using 18S RNA. N = 3, *p < 0.05, n.s., not significant from Student’s t-test. Data are mean ± S.D. (D) Measurement of LUC2 reporter and GAPDH mRNA stability after transfection of control and QKI shRNA in HeLa cells. After treatment of Actinomycin D, stability of LUC2 (Left) and GAPDH mRNAs (Right) were assessed by RT-qPCR with normalization of 18S RNA (WT QKI shRNA vs WT control/mutant control/mutant QKI). N = 3, *p < 0.05, n.s., not significant from Student’s t-test. Data are mean ± S.D. (E) AGO2 RIP assay using lysates from HeLa cells after transfection of empty vector and Myc-QKI overexpression plasmids for detection of POLR2D mRNA. (Left) After AGO2 RIP, the amount of POLR2D mRNA from immune pellets were determined by RT-qPCR with normalization to TUBA mRNA. (Right) Steady-state level of POLR2D mRNA was measured by RT-qPCR using total RNAs extracted from HeLa cells after transfection of either empty vector or Myc-QKI plasmids. N = 3, **p < 0.01, *p < 0.05, from Student’s t-test. Data are mean ± S.D. (F) AGO2 IP efficiency was verified after AGO2 immunoprecipitation and western blot analysis using lysates from HeLa cells transfected with control or Myc-QKI plasmids.
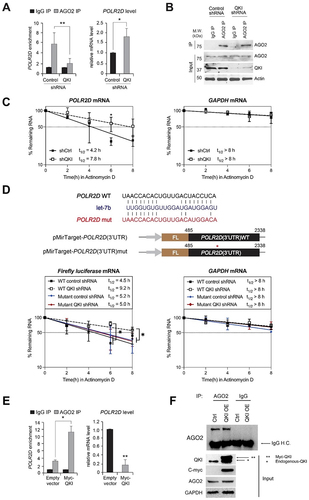
Figure 5. C-terminal region of QKI is essential for AGO2-mediated mRNA decay. (A) (Left) AGO2 RIP samples were subjected to SDS-PAGE for western blot analysis against QKI, c-Myc and GAPDH. (Middle) MYC RIP and (Right) AGO2 RIP and let-7b RT-qPCR assay were performed in HeLa cells transfected with control shRNA or QKI shRNA in combination with QKI full length or CK mutant plasmids. At 48 hours after transfection, cell lysates were subjected to immunoprecipitation against MYC-tag and AGO2 for enrichment of co-purified let-7b by RT-qPCR. N = 2, ***p < 0.001, *p < 0.05, n.s., not significant from Student’s t-test. Data are mean ± S.D.(B) RT-qPCR levels of let-7b using RNAs purified from the corresponding samples. N = 2, n.s., not significant from Student’s t-test. Data are mean±S.D.(C) Measurement of POLR2D mRNA (Left) and GAPDH mRNA stability (Right) after re-introducing QKI full length or CK mutant in QKI knockdown cells. After treatment of Actinomycin D, stability of POLR2D and GAPDH mRNAs were assessed by RT-qPCR with normalization of 18S RNA. N = 2, *p < 0.05, n.s. not significant from Student’s t-test. Data are mean ± S.D.(D) Measurement of POLD2D mRNA (Left) and GAPDH mRNA (Right) stability after transfection of Flag-tagged AGO2 expression or empty vector in HeLa cells either stably expressing control shRNA or QKI shRNA. After treatment of Actinomycin D, stability of POLR2D and GAPDH mRNAs were assessed by RT-qPCR with normalization of 18S RNA. N = 2, *p < 0.05, n.s., not significant from Student’s t-test. Data are mean ± S.D.(E) POLR2D mRNA stability assay samples were subjected to SDS-PAGE for western blot analysis against Flag, QKI and GAPDH antibodies.
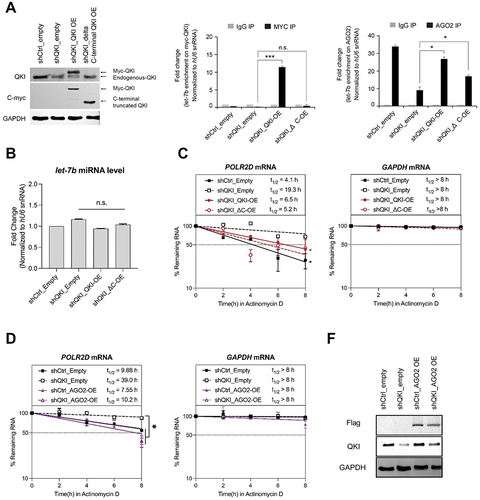
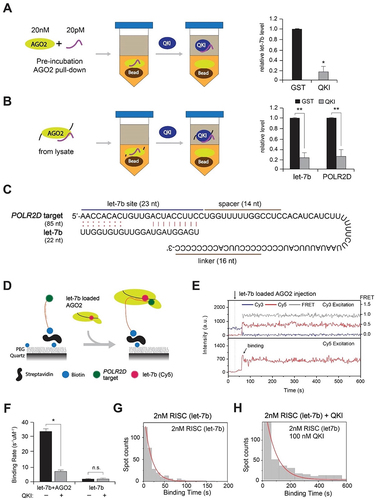
Figure 6. QKI slows down AGO2-let-7b-target RNA assembly and suppresses let-7b release. (A) Detection of let-7b released from recombinant AGO2 in vitro. AGO2 in complex with let-7b was immobilized on the sepharose beads for detection of let-7b from the supernatant, in the presence of GST or QKI using RT-qPCR. N = 3, *p < 0.05 from Student’s t-test. Data are mean ± S.D.(B) Detection of let-7b and POLR2D mRNA released from AGO2 in vivo. AGO2 in complex with let-7b and POLR2D mRNA was immobilized on the sepharose beads using HeLa cell lysates for detection of let-7b from the supernatant, in the presence of GST or QKI using RT-qPCR. N = 3, **p < 0.01 from Student’s t-test. Data are mean ± S.D.(C) Target RNA sequence of POLR2D 3’ UTR fragment containing let-7b site. Cy3 was labelled at the 5’-end and biotin was labelled at the 3’-end.(D) Single-molecule assay of RISC assembly with target RNA in the presence of QKI. The RISC solution (AGO2 and let-7b) was injected into the chamber in the presence or absence of excessive QKI (100nM) with pre-incubation for 5 minutes. (E) Representative time trace of fluorescence of Cy3 on POLR2D fragment. The RISC solution was injected into the chamber at 40 s (dashed line).(F) The binding rate of let-7b to POLR2D target was obtained through single exponential fit of the binding time histogram. The number of data is>330 each. N = 3, *p < 0.05, n.s., not significant from Student’s t-test. Data are mean ± S.D.(G,H) Histograms of binding time in (G) absence or (H) presence of recombinant OKI. The red lines are single exponential decay fit (17 s and 70 s, respectively), N = 3.
Supplemental Material
Download Zip (4.4 MB)Data availability statement
The authors confirm that the data supporting the findings of this study are available within the article and its supplementary materials.