
Figures & data
Figure 1. Investigation of RNA’s role in maintaining global protein solubility in E. coli lysates. (A) Diagram illustrating the experimental process, which includes the depletion of RNA from E. coli lysates using RNase A and subsequent fractionation into total (T), soluble (S), and insoluble (P) fractions. (B) SDS-PAGE analysis comparing protein aggregation in samples treated with RNase A and controls (upper panel) and agarose gel analysis confirming the degradation of RNA following RNase treatment (down panel). RNA degradation was assessed by treating the same volumes of samples used in the SDS-PAGE analysis with proteinase K, with each lane in the agarose gel corresponding to its respective lane in the SDS-PAGE. (C) Protein aggregation as a function of reaction time. The insoluble fractions (P1) from RNase A-treated samples were analysed on SDS-PAGE at various time points (0–15 minute). P2 represents the insoluble fraction of the control group.
Figure 2. Proteome-wide analysis of proteins responsive to RNA degradation via mass spectrometry. (A) Schematic representation of the tandem LC-MS/MS procedure utilized in combination with TMT for quantitative analysis of protein solubility under conditions with and without exogenous RNase treatment. For further details, refer to the materials and methods section. The solubility difference (ΔS) for each protein is defined as the solubility in the control group (S2/T2) minus the solubility in the RNase-treated group (S1/T1). ‘Sample 1’ and ‘Sample 2’ refer to lysates from two distinct cell cultures, underscoring the use of biological replicates in the study. (B) The number of identified proteins by mass spectrometry (left panel) and their frequency distribution as a function of ΔS (right panel). A total of 913 proteins with ΔS>0 and 53 proteins with ΔS<0 were identified, all with statistical significance (p<0.05). Of the proteins analysed, 913 showed ΔS>0 and 53 ΔS<0, each group identified with statistical significance (p<0.05). The histogram of ΔS distribution (bin size: 5%) indicates an average ΔS of 16.96% (SE ±0.36%) for proteins with ΔS>0 and−6.31% (SE ±0.5%) for proteins with ΔS<0. SE is used throughout this paper unless otherwise mentioned. (C) SDS-PAGE analysis of ΔS for individually overexpressed proteins RpsB, SseA, NusA, SsB (ΔS>0), and FabI (ΔS<0). The ΔS values obtained for each protein were used to validate the corresponding ΔS values determined by mass spectrometry in E. coli lysates. (D) Comparative analysis of ΔS between mass spectrometry (red square) and SDS-PAGE (blue circle) analyses. This comparison evaluates the ΔS values in overexpressed proteins from part (in Figure 2C) against those obtained by mass spectrometry in E. coli lysates. The ΔS values in overexpressed proteins and mass spectrometry were obtained from three and four independent experiments, respectively.
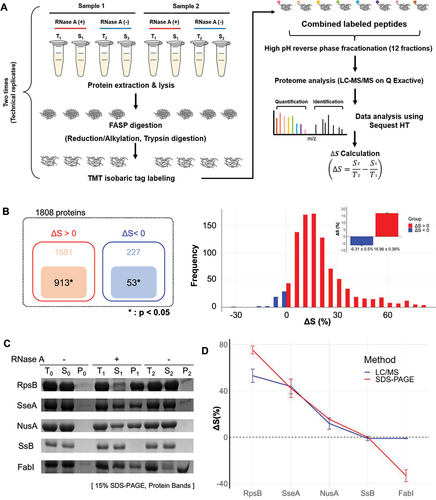
Figure 3. Proteome-wide characterization of RNA-dependent proteins in E. coli. The scatter plot displays 913 proteins with ΔS > 0 (red), 53 proteins with ΔS < 0 (blue), and the whole E. coli proteome of 4302 (grey) in terms of pI and molecular weight. Note that the red and blue spots are superimposed on the grey spots. Histograms show the absolute count of proteins across different pI values (bin size: 0.2) and molecular weight (bin size: 5 kDa) ranges. Alongside each histogram, density graphs represent the relative frequency distribution of proteins within each bin. These graphs are adjusted so that the total area under each curve sums to 1, allowing for comparison of distribution patterns across groups, irrespective of the total protein number of each group.
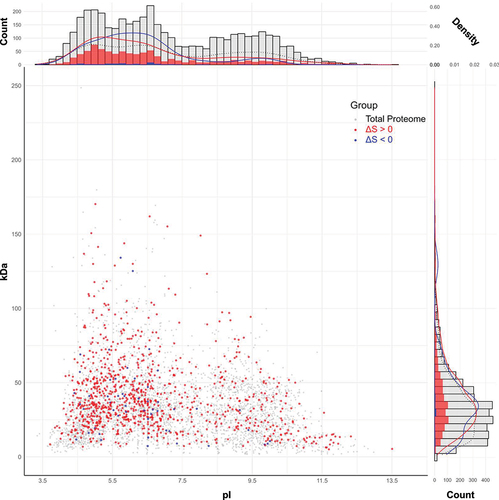
Figure 4. Analysis of the correlation between ΔS and pI across different protein groups. (A) A scatter plot comparing ΔS versus pI for the 913 proteins (ΔS > 0) and 53 proteins (ΔS < 0), further divided into acidic (pI < 7.5) and basic (pI > 7.5) groups. The linear regression equation, p-value, and R2 (coefficient of determination) values for each fitting are provided within the figure data. The plot includes SE to depict the confidence range around each data point. (B) Illustration of distinct rRNA-binding modes in acidic (S6, S2) and basic (S13, L21, S14, L20) ribosomal proteins within the ribosome structure, reflecting the different correlations observed in Figure 4A. Positively and negatively charged residues are marked in blue and red, respectively. The corresponding ΔS values and pI for these proteins are provided in the accompanying table.
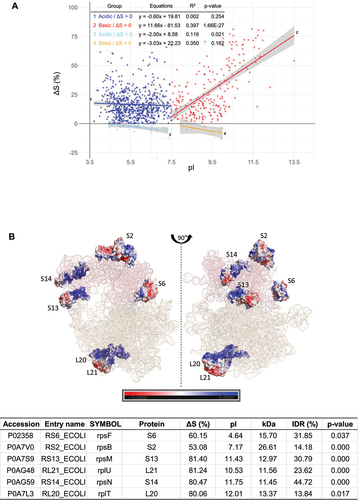
Figure 5. Analysis of the interplay between intrinsic disorder, pI, ΔS, and PPI. (A) Plot between IDRs and pI for acidic and basic proteins of proteins (ΔS > 0) and total proteome. 4302 proteins of the total proteome are depicted with grey spots and a black dotted line as a background reference. (B) Plot between IDR against protein solubility change (ΔS) for proteins with ΔS > 0 and ΔS < 0. (C) A correlation plot between PPI, as determined by a STRING score with a threshold of 0.900, and ΔS for proteins with ΔS > 0 and ΔS < 0. The linear regression equation, p-value, and R2 (coefficient of determination) values for each fitting are provided within the figure data.
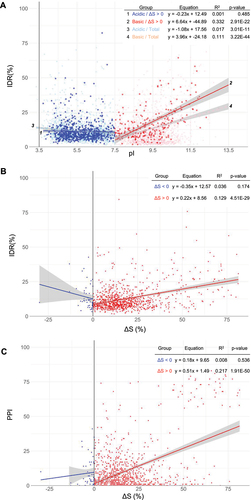
Figure 6. GO analysis between acidic and basic RNA-dependent proteins. This analysis categorizes 913 proteins with ΔS > 0 into 677 acidic and 236 basic proteins, each compared against the background of their respective acidic and basic proteins in the E. coli proteome. Further analysis was conducted on subsets (672 acidic and 191 basic proteins) after excluding 50 ribosomal proteins. The top 20 enriched GO terms were displayed for each group.
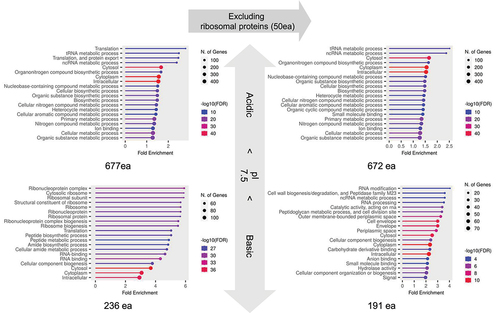
Table 1. Classification and ranking of tRNA synthetase proteins. This table displays tRNA synthetase proteins identified from our LC/MS results, sorted into classes 1 and 2 and ranked by decreasing ΔS values. Statistical significance is indicated by p values (*p < 0.05, **p < 0.01, ***p < 0.001).
Figure 7. RNA’s effects on the solubility of molecular chaperones. (A) Western blot results (left panel) showing RNA’s influence on chaperones’ solubility in response to RNA depletion and the corresponding ΔS values (right panel) of these chaperones from our mass spectrometry analysis of E. coli lysates. Statistical significance is indicated as follows: * for p < 0.05 and ** for p < 0.01. Note: TF had a low significance level in our mass spectrometry analysis. (B) Analysis of GroEL/ES client proteins impacted by RNA on solubility, categorized by their pI and molecular weight. Proteins are marked in red to indicate their inclusion in the group of 913 proteins with ΔS > 0, while those marked in black represent proteins not included in this group, referred to as ‘Others’. (C) A schematic illustrates how RNAs maintain the solubility of molecular chaperones and their client proteins by inhibiting protein aggregation.
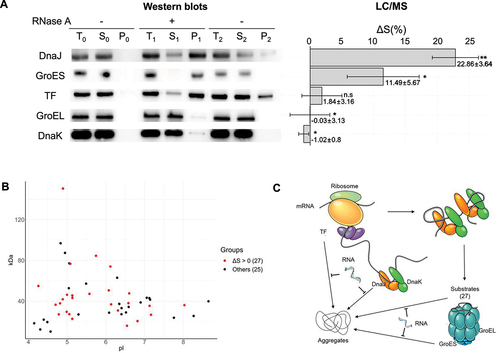
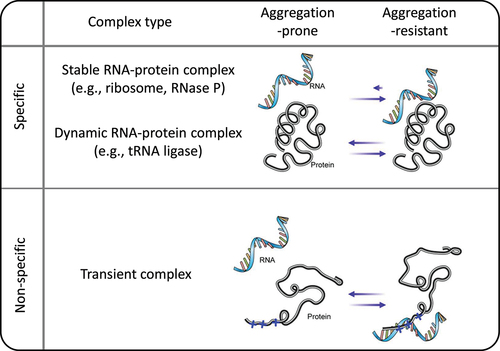
Figure 8. Proteome solubility maintenance through association with RNAs. The diagram illustrates the proteome associated with RNAs. Specific interactions involve the formation of stable and dynamic RNA-protein complexes. Non-specific interactions cover transient associations with RNAs, serving as molecular crowders within the cellular milieu.
Supplemental Material
Download Zip (4.9 MB)Data availability statement
The mass spectrometry proteomics data have been deposited to the ProteomeXchange Consortium via the PRIDE partner repository with the dataset identifier PXD040618.