
Figures & data
Figure 1. The deep learning framework of MRM-BERT.
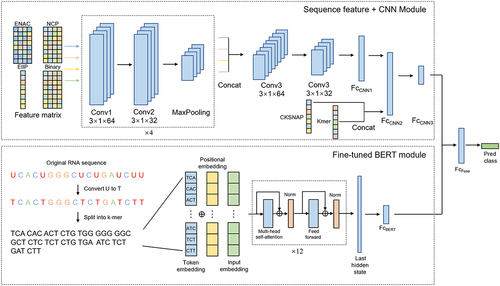
Figure 2. Comparison of prediction performance of different sequence encodings combinations. the performance shown in this figure was evaluated on the validation set of the K-fold cross-validation & testing partitioning strategy. A. Boxplots of AUC and accuracy comparing XGBoost models combining different number of encodings for AtoI modification prediction. B. Boxplots of AUC and accuracy comparing XGBoost models combining different number of encodings for psi modification prediction. C. Boxplots of AUC and accuracy comparing XGBoost models combining different number of encodings for m [Citation1]A modification prediction. D. Boxplots of AUC and accuracy comparing XGBoost models combining different number of encodings for m [Citation6]A modification prediction. E. Boxplots of AUC and accuracy comparing XGBoost models combining different number of encodings for m [Citation5]C modification prediction. F. The best-performing feature combinations and their worst AUC rankings (at worst within 15, or at worst within 30) across all modification types.
![Figure 2. Comparison of prediction performance of different sequence encodings combinations. the performance shown in this figure was evaluated on the validation set of the K-fold cross-validation & testing partitioning strategy. A. Boxplots of AUC and accuracy comparing XGBoost models combining different number of encodings for AtoI modification prediction. B. Boxplots of AUC and accuracy comparing XGBoost models combining different number of encodings for psi modification prediction. C. Boxplots of AUC and accuracy comparing XGBoost models combining different number of encodings for m [Citation1]A modification prediction. D. Boxplots of AUC and accuracy comparing XGBoost models combining different number of encodings for m [Citation6]A modification prediction. E. Boxplots of AUC and accuracy comparing XGBoost models combining different number of encodings for m [Citation5]C modification prediction. F. The best-performing feature combinations and their worst AUC rankings (at worst within 15, or at worst within 30) across all modification types.](/cms/asset/b97fbce5-a4cc-4990-8e78-546fc9ce0c16/krnb_a_2315384_f0002_oc.jpg)
Table 1. The AUC of the MRM-BERT model versus models using individual deep neural network module.
Table 2. Performance metrics of MRM-BERT on the test set from the K-fold cross-validation & testing partitioning strategy.
Table 3. Comparison of the AUC results on the original test set of MultiRM’s fixed validation and testing partitioning strategy.
Figure 3. A sample prediction result from the online MRM-BERT webserver.

Supplemental Material
Download Zip (5.5 MB)Data availability statement
The data that support the findings of this study are openly available in FigShare at doi: 10.6084/m9.figshare.24873195, reference number 24,873,195. The source code of this study is openly available in Github at https://github.com/abhhba999/MRM-BERT