
Figures & data
Table 1. Origin of IVT mRNA byproducts.
Figure 1. A) as measured by spectrophotometry, one molar urea supplementation to T7 RNAP-based IVT reactions (2 hours at 37°C) has a minor impact on mRNA yield. In contrast, VSW3 RNAP-based IVT (16 hours at 25°C) results in significantly less mRNA. The dots represent independent IVT reactions, and all reactions employed m1Ψ. B) agarose gel electrophoresis reveals a smear of shorter mRNA transcripts in VSW3 IVT, both before and after a vaccinia capping reaction. C) smear analysis on 5% polyacrylamide gel indicates that an additional silica purification (2×) does not substantially remove shorter transcripts. PAGE further confirms the presence of many shorter transcripts in VSW3 mRNA. D) commercially acquired CleanCap® FLuc mRNA (TriLink BioTechnologies) was subjected to heat at the indicated temperature and time. 500 ng of this mRNA was then translated in a rabbit reticulocyte lysate assay (RRL) in the presence of substrate D-luciferin (3 technical replicates, bars indicate SD). E) the protein production of 500 ng capped and silica-purified fluc mRNA was used in an RRL reaction as described in figure 1D. Analysis of the AUC of these graphs indicates a higher number of full-length transcripts in the urea-supplemented T7 mRNA and significantly less functional fluc-encoding transcripts in the VSW3 IVT mRNA (3 technical replicates, bars indicate SD).
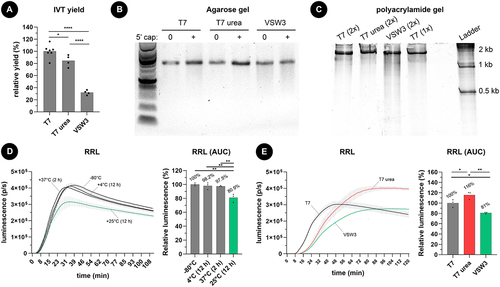
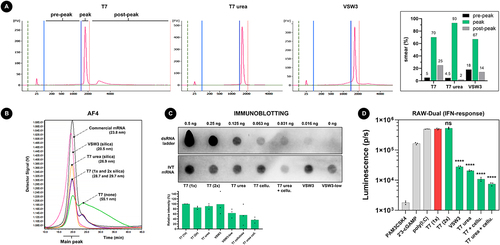
Figure 2. A) addition of 1 M urea to the IVT reaction decreases both shorter and longer transcript impurities. 200 ng of IVT mRNA was loaded per lane on an agilent bioanalyzer 2100 system in non-denaturing conditions. The indicated pre-peak, peak, and post-peak regions on the electropherogram were used during smear analysis (right graph). B) AF4 analysis of about 500 ng mRNA per sample confirms that VSW3 mRNA is mainly contaminated with transcripts of low MW. In contrast, urea T7 mRNA is cleared from both low and high MW transcripts. The measured radius of gyration of each sample is listed between parentheses. C) Representative immunoblot using the J2 antibody. 5 µg mRNA was analysed per sample and compared to the intensity of a dsRNA ladder dilution. The bottom graph depicts the average relative intensities of 3 independent dot blot assays (one-way ANOVA p = 0.0556). D) RAW-DualTM cells were transfected with controls (grey bars) or IVT mRNA samples (green bars). The asterisks indicate statistically lower luminescence compared to the reference T7 (1×) sample (red bar). Additional pairwise comparisons (excluding the controls) were performed but did not find significant differences after correction for multiple comparisons.
Supplemental Material
Download TIFF Image (5.1 MB)Data availability statement
The authors confirm that the data supporting the findings of this study are available within the article and its supplementary materials.