
Figures & data
Figure 1. Comparison of Synechocystis RNase E with phylogenetically distant RNase E homologues. (A) Scheme comparing the domain structure of E. coli RNase E to Synechocystis RNase E. The shown E. coli domain organisation and localisation of the membrane-targeting site as well as PNPase and RNase II binding sites are indicated according to Aït-bara et al. [Citation20]. The localisation of eight amino acids that are dependent on the 5’ bypass target recognition pathway is based on Bandyra et al., 2018 and Clarke et al., 2023 [Citation17,Citation21]. For Synechocystis RNase E, the presence of conserved and variable regions was indicated according to [Citation22]. The Synechocystis RNase E amino acids F64, K98, K494 and K512 bind RNA and were identified by UV-crosslinking to CRISPR3 crRNA [Citation23]. We indicated putative binding sites for enolase, DEAD-box RNA helicase CrhB and RNase II (identified only for Nostoc sp. PCC 7120 (Nostoc) RNase E so far [Citation24,Citation25]). In Nostoc, enolase and CrhB bind to the RNase H-like and DNase I-like domains of RNase E (yellow, dark blue) [Citation24] and RNase II interacts with the N-terminal half of RNase E (N-terminal of V1) [Citation25]. (B) Alignment of Synechocystis RNase E residues 115 to 162 with the respective section in homologues from Arabidopsis thaliana, Nostoc, Gloeobacter violaceus PCC 7412, E. coli (K12), Caulobacter crescentus (CB15), Rhodobacter sphaeroides 2.4.1 and E. coli (K12) RNase G. Arrows point at key amino acids forming the 5’ sensor pocket in E. coli RNase E [Citation17,Citation19]. Shades of blue indicate different degrees of identity between the compared protein sequences.
![Figure 1. Comparison of Synechocystis RNase E with phylogenetically distant RNase E homologues. (A) Scheme comparing the domain structure of E. coli RNase E to Synechocystis RNase E. The shown E. coli domain organisation and localisation of the membrane-targeting site as well as PNPase and RNase II binding sites are indicated according to Aït-bara et al. [Citation20]. The localisation of eight amino acids that are dependent on the 5’ bypass target recognition pathway is based on Bandyra et al., 2018 and Clarke et al., 2023 [Citation17,Citation21]. For Synechocystis RNase E, the presence of conserved and variable regions was indicated according to [Citation22]. The Synechocystis RNase E amino acids F64, K98, K494 and K512 bind RNA and were identified by UV-crosslinking to CRISPR3 crRNA [Citation23]. We indicated putative binding sites for enolase, DEAD-box RNA helicase CrhB and RNase II (identified only for Nostoc sp. PCC 7120 (Nostoc) RNase E so far [Citation24,Citation25]). In Nostoc, enolase and CrhB bind to the RNase H-like and DNase I-like domains of RNase E (yellow, dark blue) [Citation24] and RNase II interacts with the N-terminal half of RNase E (N-terminal of V1) [Citation25]. (B) Alignment of Synechocystis RNase E residues 115 to 162 with the respective section in homologues from Arabidopsis thaliana, Nostoc, Gloeobacter violaceus PCC 7412, E. coli (K12), Caulobacter crescentus (CB15), Rhodobacter sphaeroides 2.4.1 and E. coli (K12) RNase G. Arrows point at key amino acids forming the 5’ sensor pocket in E. coli RNase E [Citation17,Citation19]. Shades of blue indicate different degrees of identity between the compared protein sequences.](/cms/asset/fcb9d01f-86be-4df4-925b-3115fc1a6dd0/krnb_a_2328438_f0001_oc.jpg)
Figure 2. Impact of amino acid exchange T161V and characterisation of Synechocystis strains rne(WT) and rne(5p). (A) In vitro assay comparing the cleavage activity of Synechocystis wild-type RNase E (WT), RNase E with amino acid exchange T161V (5p) and catalytically inactive RNase E [Citation23] harbouring the amino acid exchange D296N on a 113 nt long transcript derived from the 5’ UTR and the first 20 codons of psbA2. The 5’ termini were either triphosphorylated (5’PPP), monophosphorylated (5’P) or hydroxylated (5’OH). A prominent band appearing only for the 5’P substrate incubated with wild-type RNase E, but not for the other enzyme variants, is indicated by an asterisk. One representative SYBR-gold-stained urea-containing 8% polyacrylamide gel is shown (n = 5). M: marker. (B) Absorption spectra of wild-type Synechocystis (WT), rne(WT) and rne(5p). Shaded areas indicate standard deviations of three replicates. (C) Spot assays testing the growth of WT, rne(WT) and rne(5p) under photoautotrophic and photomixotrophic (5 µM glucose) conditions under continuous and 12 h light/12 h dark cycles (n > 4). (D) Urea-containing polyacrylamide gel of total RNA from WT, rne(WT), rne(5p) and empty-vector control strain pVZΔKmR (pVZ) stained with ethidium bromide. (E) The same gel after northern blotting and hybridisation with a radioactively labelled probe for 5S rRNA. One representative analysis is shown (n = 4). # indicates mature 5S rRNA, * 5S rRNA precursors. A control hybridisation with RnpB is shown (lower panel).
![Figure 2. Impact of amino acid exchange T161V and characterisation of Synechocystis strains rne(WT) and rne(5p). (A) In vitro assay comparing the cleavage activity of Synechocystis wild-type RNase E (WT), RNase E with amino acid exchange T161V (5p) and catalytically inactive RNase E [Citation23] harbouring the amino acid exchange D296N on a 113 nt long transcript derived from the 5’ UTR and the first 20 codons of psbA2. The 5’ termini were either triphosphorylated (5’PPP), monophosphorylated (5’P) or hydroxylated (5’OH). A prominent band appearing only for the 5’P substrate incubated with wild-type RNase E, but not for the other enzyme variants, is indicated by an asterisk. One representative SYBR-gold-stained urea-containing 8% polyacrylamide gel is shown (n = 5). M: marker. (B) Absorption spectra of wild-type Synechocystis (WT), rne(WT) and rne(5p). Shaded areas indicate standard deviations of three replicates. (C) Spot assays testing the growth of WT, rne(WT) and rne(5p) under photoautotrophic and photomixotrophic (5 µM glucose) conditions under continuous and 12 h light/12 h dark cycles (n > 4). (D) Urea-containing polyacrylamide gel of total RNA from WT, rne(WT), rne(5p) and empty-vector control strain pVZΔKmR (pVZ) stained with ethidium bromide. (E) The same gel after northern blotting and hybridisation with a radioactively labelled probe for 5S rRNA. One representative analysis is shown (n = 4). # indicates mature 5S rRNA, * 5S rRNA precursors. A control hybridisation with RnpB is shown (lower panel).](/cms/asset/e29a17f7-4518-4b49-bcfc-5f7c324d6460/krnb_a_2328438_f0002_oc.jpg)
Figure 3. Overview of the RNA-seq experiment. (A) Experimental setup. RNA was sampled from triplicates of wild-type Synechocystis (WT), rne(WT) and duplicates of rne(5p). (B) RNA was extracted and used for cDNA library preparation distinguishing between processing sites (PSS), transcriptional start sites (TSS) and other (unspecified) transcript positions. PSS- and TSS-tags, which are sequencing adaptors containing PSS- and TSS-specific nucleotide combinations, were ligated to the respective RNA 5’ ends before or after terminator exonuclease treatment and 5’ pyrophosphate removal. (C) Principal component analyses comparing replicates of the different strains using normalised count matrices for PSS, TSS and other transcript reads separately. The latter was analysed at the transcript type/segment level. Transcript types and segments include coding sequences (CDS), known sRNAs and asRNAs [Citation49,Citation64,Citation65] as well as 5’ untranslated regions (UTRs) and 3’ UTRs based on the total of 4,091 transcriptional units (TUs) defined by Kopf et al. [Citation50].
![Figure 3. Overview of the RNA-seq experiment. (A) Experimental setup. RNA was sampled from triplicates of wild-type Synechocystis (WT), rne(WT) and duplicates of rne(5p). (B) RNA was extracted and used for cDNA library preparation distinguishing between processing sites (PSS), transcriptional start sites (TSS) and other (unspecified) transcript positions. PSS- and TSS-tags, which are sequencing adaptors containing PSS- and TSS-specific nucleotide combinations, were ligated to the respective RNA 5’ ends before or after terminator exonuclease treatment and 5’ pyrophosphate removal. (C) Principal component analyses comparing replicates of the different strains using normalised count matrices for PSS, TSS and other transcript reads separately. The latter was analysed at the transcript type/segment level. Transcript types and segments include coding sequences (CDS), known sRNAs and asRNAs [Citation49,Citation64,Citation65] as well as 5’ untranslated regions (UTRs) and 3’ UTRs based on the total of 4,091 transcriptional units (TUs) defined by Kopf et al. [Citation50].](/cms/asset/f38edc8e-168b-45e9-aa50-b8e04b22902a/krnb_a_2328438_f0003_oc.jpg)
Table 1. Pair-wise comparison of the number of transcriptional units (TU), processing sites (PSS), transcriptional start sites (TSS) and various transcript types and segments differentially expressed (|log2FC| > 1.0 and p.adj < 0.05) between rne(WT), rne(5p) and wild-type Synechocystis (WT). Transcript types and segments include coding sequences (CDS), known sRNAs and antisense RNAs (asRNAs) [46,107,108] as well as 5’ untranslated regions (UTRs) and 3’ UTRs based on the total of 4,091 TUs defined by Kopf et al. [47]. PSS and TSS include previously identified positions [37]. Numbers in parentheses give percentages relative to all representatives of the respective type.
Table 2. Pair-wise comparison of the number of transcript types and segments differentially expressed (|log2FC| > 1.0 and p.adj < 0.05) between rne(WT), rne(5p) and WT. Transcript types and segments include coding sequences (CDS), annotated sRNAs and antisense RNAs (asRNAs) [46,107,108] as well as 5’ untranslated regions (UTRs) and 3’ UTRs based on a total of 4,091 transcriptional units (TU) defined by Kopf et al. [47]. Numbers in parentheses give percentages relative to all regions of the respective type. ‘Total’ gives the total number of representatives of the respective type.
Figure 4. Effect of overexpression of the rne-rnhB operon on the transcriptome and copy number of plasmids pSYSA and pSYSM. (A) Gene set enrichment analysis (GSEA) comparing enrichment of transcripts derived from different replicons. Transcript reads were assigned to transcriptional units (TUs). Those were ranked by log2FC values, as depicted in the lowest part of the diagram. The middle part shows which TUs are encoded by which replicon and the top part shows the running enrichment score associated with a replicon. This was calculated by testing the overrepresentation of a term compared to a random background distribution. Data are only shown for replicons with significant differences between strains (compare Supp. Tables S13 and S14). (B) Southern blot comparing relative amounts of pSYSA, pSYSM and chromosomal DNA in different strains. DNA was digested with HindIII restriction enzyme. One representative analysis is shown (n = 3). Chromo: hybridisation signal corresponding to chromosomal DNA. (C) Quantification of hybridisation signals for pSYSA and pSYSM, normalised by chromosomal hybridisation signal. Dots represent biological replicates, gray bars the means of replicates, normalised to the WT values. pSYSA signal detected in rne(5p) and rne(WT) was significantly higher than in WT or the empty-vector control (p.adj < 0.05) as well as pSYSM signal detected in rne(WT) compared to WT (p.adj < 0.05). pVZ: empty vector control strain pVZΔKmR.
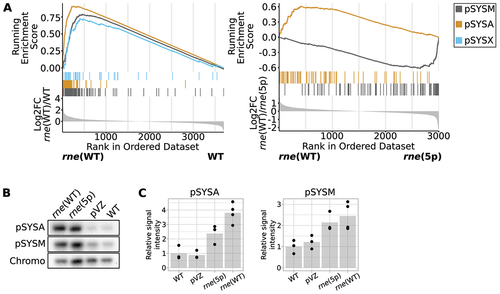
Figure 5. Impact of RNase E on rRNA and tRNA maturation. (A) RNA-seq data for tRNAGluUUC (6803t14). The PSS peak, which is located at the 5’ end of mature tRNA, was reduced in rne(5p) compared to rne(WT) (log2FC(rne(WT)/rne(5p) = 1.6, p.adj = 0.015). (B) RNA-seq data for 5S rRNA (rrn5Sb). Dashed vertical lines indicate the 5S rRNA 5’ end detected in WT and rne(WT). Solid vertical lines indicate the 3’ ends of 5S rRNA detected in WT and rne(WT) (left) or rne(5p) (right). Stars (*) indicate the transcript boundaries used for in vitro cleavage assays (see 5C). Cleavage sites P1, P2 and P3 are displayed in the diagrams underneath by black, blue and orange peaks, respectively, representing 5’-P (PSS) RNA ends. Transcriptome coverage is given on top for the three indicated strains. Transcriptome coverage and PSS represent the average of normalised read counts of the investigated replicates for the indicated strains. Small grey arrows indicate strand orientation. Further details are provided in Supp. Results S2. (C) In vitro cleavage assay of a 209 nt 5S rRNA precursor equivalent to the E. coli 9S RNA. Transcript boundaries were determined according to the RNA-seq transcript coverage (). Assays were conducted on transcripts with either 5’-triphosphorylated (5’PPP) or 5’-monophosphorylated (5’P) ends with Synechocystis wild-type RNase E (WT), or enzymes harbouring the amino acid exchanges T161V (5p) or D296N (inactive enzyme). One representative urea-containing polyacrylamide gel is shown (n = 3). M: marker. (D) Gene set enrichment analysis (GSEA) using KEGG terms and unspecified transcript reads mapped to CDS. Detected CDS were ranked by their log2FC values (lowest part of the diagram). KEGG pathways are colour-coded and the middle part of the diagram illustrates where CDS belonging to a specific KEGG pathway are located within the ranked list. The upper most part shows the running enrichment score, i.e. the enrichment of a KEGG pathway compared to a random distribution over the whole ranked list. The non-redundant KEGG pathway ‘ribosome’ with a significant enrichment score is shown (compare Supp. Tables S13 and S14).
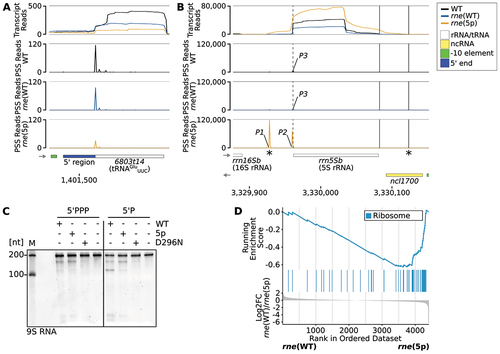
Table 3. Processing sites (PSS) in tRNAs differentially regulated between rne(WT) and rne(5p) with |log2FC|>1.5 and adjusted p.adj values < 0.05. The corresponding transcriptional units (TU) are indicated according to Kopf et al. [Citation50].
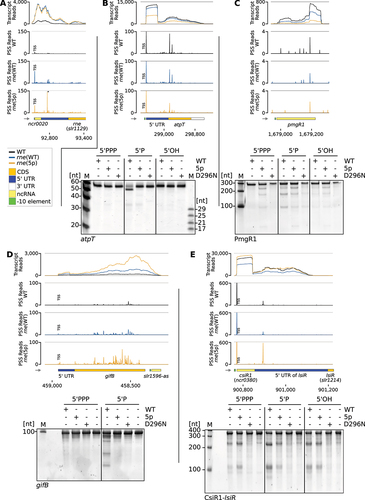
Figure 6. Examples of 5’-sensing-dependent cleavage events. RNA-seq data for: (A) The 5’ UTR of rne. Low transcript read counts in the immediate vicinity of the 5’ end of the rne coding sequence are an artefact due to the introduced 3×FLAG sequence in rne(WT) and rne(5p), which is missing in the sequence to which the reads were mapped. The prominent 5’-sensing-dependent PSS, which is marked by an asterisk, is located at position 92,762. (B) The gene atpT including its 5’ and 3’ UTR and verification by in vitro cleavage assay. (C) The pmgR1 gene and in vitro cleavage assay with the encoded sRNA PmgR1. (D) The gifB gene including its 5’ UTR and the asRNA located downstream, slr1596-as; below in vitro cleavage assay with the 5’ UTR of gifB. (E) The 5’ UTR of lsiR, including the sRNA CsiR; below in vitro cleavage assay with the CsiR1-lsiR transcript. (a-e) Transcriptome coverage is given on top for the three indicated strains. Cleavage sites are displayed in diagrams below by black, blue and orange peaks, representing 5’-P (PSS) detected in the three different strains. 5’-PPP (TSS) may be converted to 5’-P RNA ends in vivo or during RNA-seq library preparation. Thus, TSS are partially detected in the PSS signal. Positions that were classified as TSS are indicated by ‘TSS’ next to the respective peaks. Transcriptome coverage and cleavage sites (PSS) represent the average of normalised read counts of the investigated replicates. Small grey arrows indicate strand orientation. CDS: coding sequences, UTR: untranslated region, ncRNA: sRNAs and asRNAs. In vitro cleavage assays comparing the processing of several transcripts (either 5’-triphosphorylated (5’PPP), 5’-monophosphorylated (5’P) or 5’-hydroxylated (5’OH)) by Synechocystis wild-type RNase E (WT), or enzymes harbouring the amino acid exchanges T161V (5p) or D296N. Cleavage assays are representative results of 3 to 4 replicates. M: marker.
Supplemental file.pdf
Download PDF (18.3 MB)Data availability statement
FastQ files from RNA sequencing were deposited in the Gene Expression Omnibus (GEO) Data bank under accession number GSE184824. Galaxy workflows used for raw read processing and several downstream analysis steps are available online: https://usegalaxy.eu/u/ute-hoffmann/w/5sens-seq-preprocessing, https://usegalaxy.eu/u/ute-hoffmann/w/5sensing-pss-tss, https://usegalaxy.eu/u/ute-hoffmann/w/5sensing-transcript, https://usegalaxy.eu/u/ute-hoffmann/w/5sensing-transcript-coverage
All further codes used for data processing and analysis are available online in the GitHub and Zenodo repositories (https://github.com/ute-hoffmann/5sensing_Synechocystis, https://doi.org/10.5281/zenodo.7509657).