
Figures & data
Figure 1. Schematic view of chemistry and Bo-sequencing methodology. Schematic overview of the Bo-Seq method. Representation of the sequential steps: i) size-selection of tRnas and de-aminoacylation; ii) chemical reactions leading to the RNA chain cleavage; iii) 5’ phosphorylation, adaptor ligation (RNA adaptors are indicated in blue and green, RNA in red); iv) library preparation and sequencing; v) bioinformatic analysis (reads are indicated in grey).
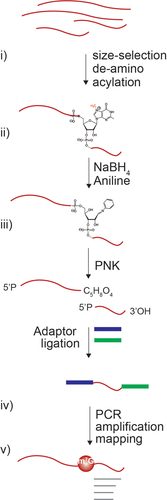
Figure 2. Cleavage at m7G is highest when RNAs are treated with 1 M NaBH4, aniline and m7GMP. (a) schematic representation of prokaryotic 16S rRNA methylated at G527. Treatment with NaBH4 and aniline lead to the generation of two RNA fragments. (b) optimization of 16S rRNA cleavage reaction at methylated position m7G527 with NaBH4 and aniline. The different reaction conditions applied are indicated in the upper panel of the agarose gel. Ladd: ladder. * indicates the full length 16S rRNA and arrows indicate the derived fragments. (c) schematic representation of human 18S rRNA with m7G at position G1639. Cleavage of 18S rRNA using NaBH4 and aniline lead to the formation of two RNA fragments. Arrow indicates the position of primers in the primer extension reaction. (d) primer extension analysis performed in human 18S rRNA untreated (-) or treated with 1 M NaBH4 pH 7.5, aniline and m7GMP. (e) each cleaved fraction represents the densitometry of the RT-stop bands relative to the full-length product + each RT-stop (m7G + N+1 sites) band. The uncleaved fraction represents the densitometry of the full-length product relative to the full-length product + each RT-stop band. (f) schematic representation of tRNA with m7G at position G46, and the cleavage that leads to the formation of tRNA fragments. Arrow indicates the position of primers in the primer extension reaction. (g) primer extension analysis performed in human tRnas untreated (-) or treated with NaBH4 pH 7.5, aniline and m7GMP. The arrow indicates the RT-stops. (h) the fraction cleaved represents the relative densitometry of the sum of each RT-stop bands (m7G + N+1 sites) relative to the relative densitometry of the sum of each RT-stop bands (m7G + N+1 sites) in condition 4.
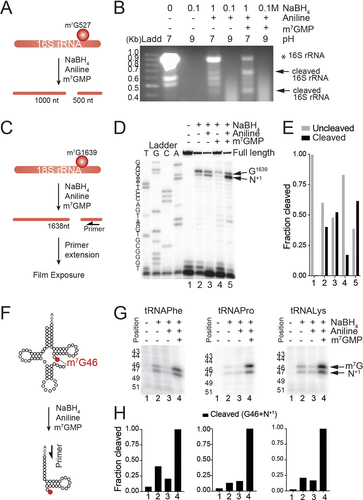
Figure 3. Heatmap showing normalized tRNA fragments read coverage mapped to individual tRNA isoacceptors derived from NaBH4-treated RNAs from DU145 cells. Black boxes indicate cleavage site, corresponding to G46 + 1. In red are methylated tRNA isoacceptors.
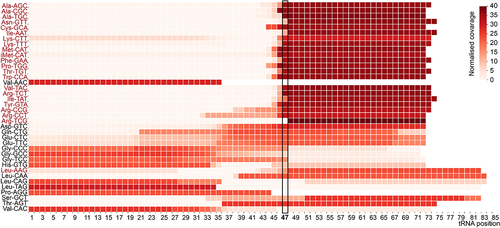
Figure 4. Detection of m7G-methylated and unmethylated tRnas using Bo-Seq. A, B) Representative cleavage score profiles of methylated (a) and unmethylated (b) tRnas from DU145 cells. c, d) read coverage of fragmented tRnas after NaBH4/Aniline treatment of PC3 METTL1 KO (grey lines) and WT (red lines) RNAs for the indicated m7G methylated (c) and non-methylated tRnas (d). Circles represent the tRNA fragment (tRF) start sites. Red arrows indicate cleavage position.
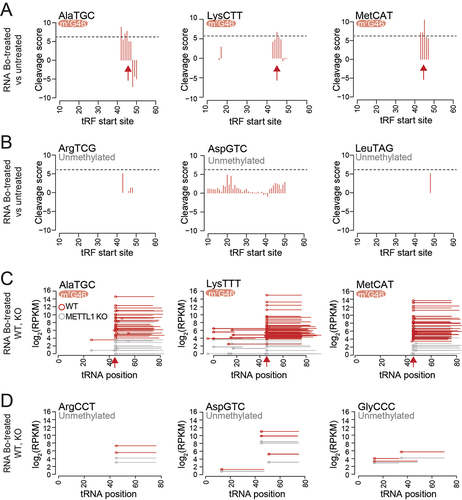
Figure 5. Global detection of m7G in tRNA by dot blot. (a) sensitivity of MBL and biovision (BIO) anti-m7G antbodies at detecting m7G in total RNA. m7G-hypermethylated RNA was used as a control. (b) quantitative detection of m7G-modified RNAs in increasing levels of total RNA and tRnas from the human cell line PC3 using MBL and biovision (BIO) anti-m7G antibodies. One replicate for each condition is shown in the upper panel. Methylene blue staining is used as loading control. (c) bar plots represent densitometry quantification of signal intensity (in arbitrary units) using ImageJ software, normalized to methylene blue. Mean ± SD is represented (n = 3). (d) evaluating the specificity of MBL and biovision anti-m7G antibodies by competing with m7G-hypermethylated RNA (m7G-RNA at 20 μg, 200 μg, and 1000 μg), m7GTP (at 1 μg, 2 μM, and 4 μM) and GTP (at 1 μM, 2 μM, and 4 μM). E) METTL1 protein expression levels in single-cell derived clones of PC3 control (WT) and PC3 METTL1 KO cell lines. Tubulin was used as loading control. e, f) dot blot assay of tRnas and large RNAs (>200 nt) from PC3 control (WT) and METTL1 KO cell lines after incubation with MBL (e) and biovision (f) anti-m7G antibodies. Two technical replicates from three biological replicates are shown for every condition. Densitometry quantification is shown at the bottom. Mean ± SD are represented (n = 2). Dotted lines represent average densitometry to all METTL1 KO tRNA samples. Statistics: one-tailed Student’s t-test: *p < 0.05; **p < 0.01; ***p < 0.001.
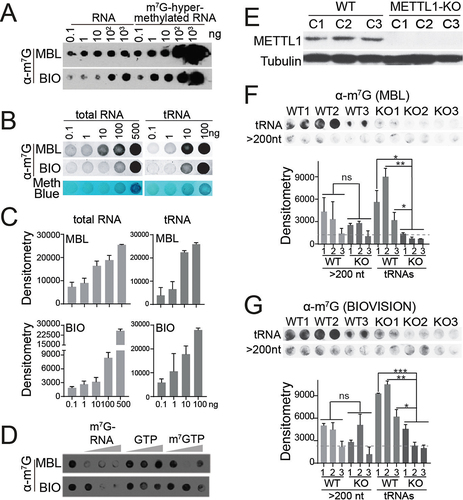
Table 1. Description of available methods for internal m7G mapping in RNA.