
Figures & data
Figure 1. Characteristics of sRNAs in the investigated molluscs. (a) length distribution of clean reads in C. nippona; (b) length distribution of clean reads in M. galloprovincialis; (c) base composition at each site of the unique sRNA read from the 5’ terminal in C. nippona; (d) mapping statistics of clean reads among different RNA types in molluscs annotated by sRnatools using zebrafish (danio rerio) as the reference.
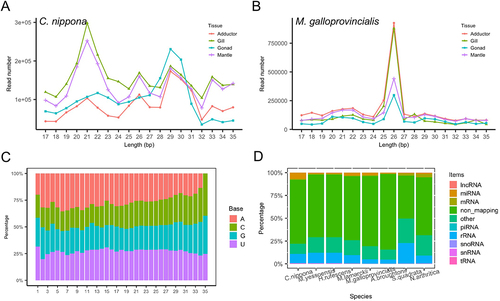
Table 1. Statistics of small RNA sequencing result of the eight investigated molluscs.
Figure 2. miRNA identification in the investigated molluscs. (a) venn diagram of common and unique miRnas identified in the investigated molluscs; (b) Principal component analysis (PCA) of miRNA expression patterns in molluscs; (c) boxplot of miRNA expression density in molluscs. Adductor muscle collected from bivalves and foot muscle from gastropods; (d) alignment of precursors of miR-22-3p in molluscs; (e) alignment of precursors of miR-87 in molluscs; i1/i2/i3 indicates multiple miRNA isoforms; ‘pre’ represents precursor. The underline shows mature miRNA sequences.
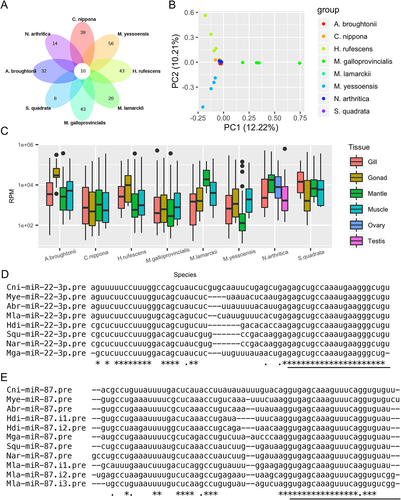
Figure 3. Target prediction of miRnas in A. broughtonii. (a) venn diagram of the number of predicted target sites between genes and miRNAs using miRanda and RNA22 algorithms. (b) the number of target genes for each miRNA. (c) miRnas-target genes regulatory network of miRnas in A. broughtonii. (d) kyoto encyclopaedia of genes and genomes (KEGG) pathways, terms, and statistics of the KEGG pathway enrichment analysis for the predicted target genes of miRnas in A. broughtonii.
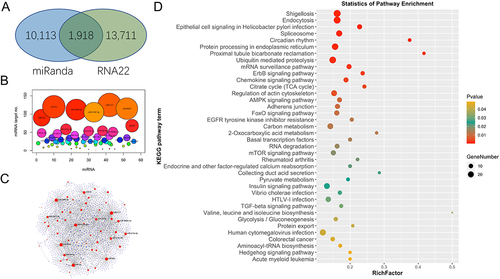
Figure 4. Characteristics of piRNAs in the investigated molluscs. (a) length distribution of filtered known ncRNAs; (b) ping-pong pair reads of putative piRNAs; (c) ping-pong Z10 score for the enrichment of 10-bp overlaps; (d) ping-pong matrices illustrate frequent length-combinations of ping-pong pairs (sequences with a 10-bp 5’ overlap; E: putative piRNA length distribution and 1 U/10A bias for ping-pong reads.
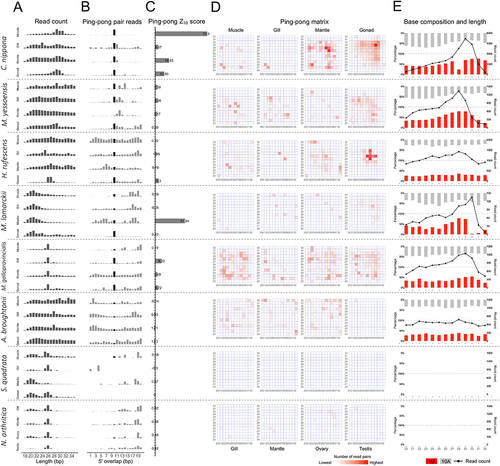
Table 2. Identification of miRNAs and piRNAs in the investigated molluscs.
Figure 5. Heat map of expression levels of piRNA clusters in molluscs somatic and gonadal tissues. (a) C. nippona; (b) M. lamarckii; (c) M. yessoensis; (d) A. broughtonii; (e) H. rufescens; (f) M. galloprovincialis. ad: adductor muscle; Fo: foot muscle; gi: gill tissue; ma: mantle tissue; go: gonad.
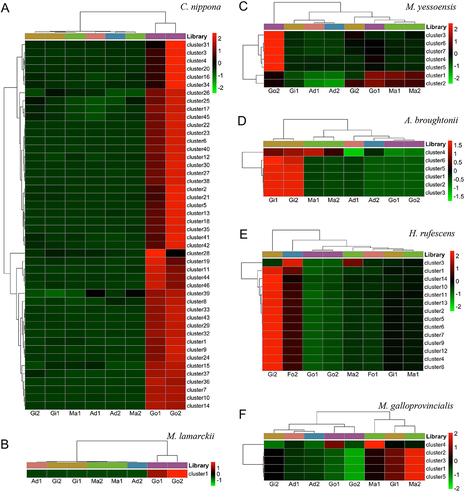
Figure 6. Transposon annotation in genome and piRNA clusters in the investigated molluscs. (a) representation of transposons in the genome of C. gigas, plotted by divergence [%] from transposon consensus. (b) representation of transposons within piRNA clusters of C. nippona plotted by divergence [%] from transposon consensus. (c) prominent transposons that are enriched or depleted in C. nippona piRNA clusters. (d) representation of transposons in the genome of M. yessoensis, plotted by divergence [%] from transposon consensus. (e) representation of transposons within piRNA clusters of M. yessoensis, plotted by divergence [%] from transposon consensus. (f) prominent transposons that are enriched or depleted in M. yessoensis piRNA clusters.
![Figure 6. Transposon annotation in genome and piRNA clusters in the investigated molluscs. (a) representation of transposons in the genome of C. gigas, plotted by divergence [%] from transposon consensus. (b) representation of transposons within piRNA clusters of C. nippona plotted by divergence [%] from transposon consensus. (c) prominent transposons that are enriched or depleted in C. nippona piRNA clusters. (d) representation of transposons in the genome of M. yessoensis, plotted by divergence [%] from transposon consensus. (e) representation of transposons within piRNA clusters of M. yessoensis, plotted by divergence [%] from transposon consensus. (f) prominent transposons that are enriched or depleted in M. yessoensis piRNA clusters.](/cms/asset/91ce4d22-5035-4672-bdce-5049eb20b236/krnb_a_2348893_f0006_oc.jpg)
Supplementary materials_R1.docx
Download MS Word (4.7 MB)Data availability statement
The raw sequencing reads from smRNA-seq are available in the DNA Data Bank of Japan (DDBJ) Sequence Read Archive (DRA) under the accession number DRA012198.