
Figures & data
Figure 1. The Nm-Nano framework for predicting Nm sites on (a) HeLa cell line using random 80/20 train/test split (b) 50% of the combination of HeLa and HEK293 benchmark dataset using integrated validation testing with random 50/50 train/test split on this combination (c) analysis performed based on Nm-Nano predictions.
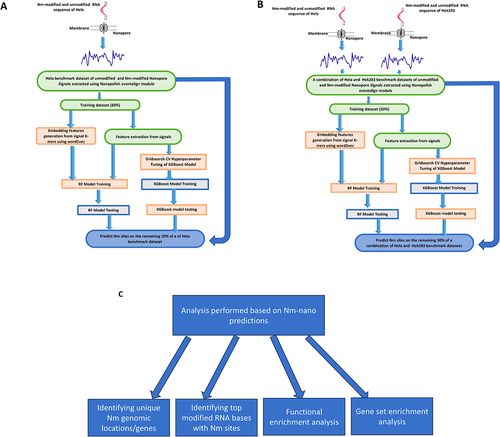
Table 1. The performance of Nm-Nano predictors on HeLa benchmark dataset with random-test splitting.
Figure 2. The learning, loss and ROC curves of Nm-nano predictors validated on HeLa benchmark dataset with random split testing, where 80% of data is used for training and the remaining 20% is kept for testing. (a, b, and c) XGBoost model and (d, e, and f) RF with K-mer embedding model.
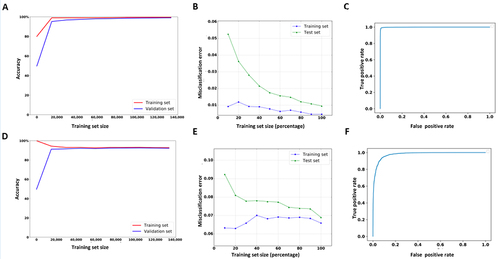
Table 2. The performance of Nm-Nano predictors on HeLa benchmark dataset in terms of accuracy (%) with random test-splitting using single type of feature.
Table 3. The performance of XGBoost versus the performance of the XGBoost with K-mer embedding model applied to HeLa benchmark dataset with random test-splitting.
Figure 3. The learning, loss and ROC curves of Nm-Nano predictors in integrated validation testing, where 50% of the combination of HeLa and HEK293 benchmark datasets was used for training and the remaining 50% was used for testing. (a,b, and c) XGBoost model and (d, e, and f) RF with K-mer embedding model.
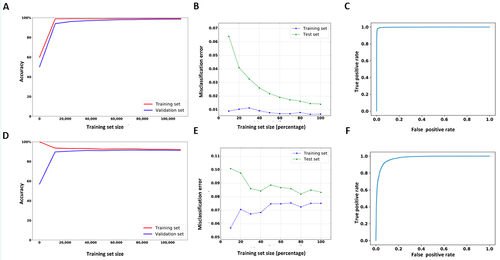
Table 4. The performance of Nm-Nano predictors on a combination of HeLa & HEK293 benchmark datasets with 0.5 random-test splitting.
Table 5. The performance of nm-nano predictors with integrated validation testing in terms of accuracy (%) using a single type of feature.
Figure 4. (a) The overlap between unique Nm locations in the complete dataset of HEK293 and HeLa cell lines (b) The overlap between most frequent (top 1%) modified Nm genes in HEK293 and HeLa cell lines (c) A density plot illustrating Nm modifications’ distribution across normalized gene length for HEK293 and HeLa cell lines.
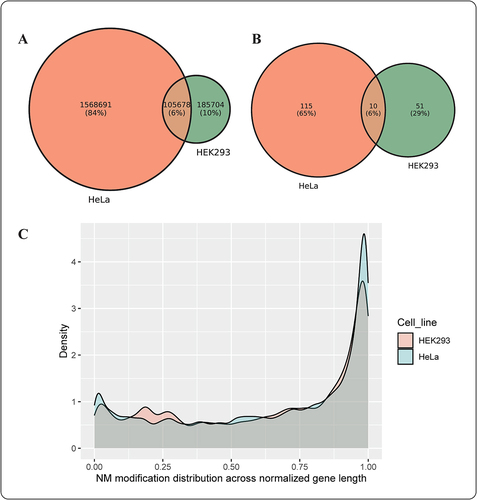
Table 6. The percentage of unique nm locations occurring for each of the four RNA bases in the HeLa and HEK293 cell lines.
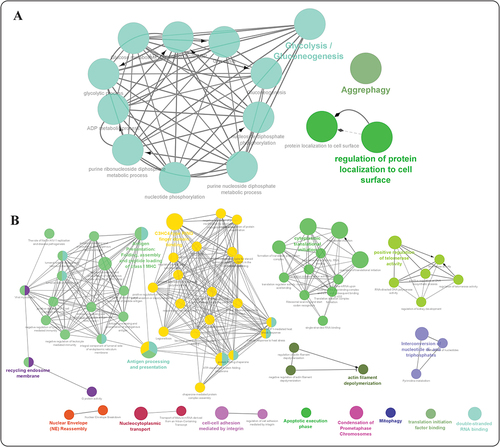
Figure 5. Functional enrichment analysis of genes with the highest frequency of Nm modifications within a specific cell line, grouped based on the functional hierarchy of Gene Ontology (GO) terms using the Cytoscape ClueGO application. (a) HEK293 cell line and (b) HeLa cell line (visualizing high confidence (p-val <0.05) ontologies and pathways potentially associated with nm RNA modification. The size of the nodes is representative of the significance of association with respect to genes per GO-term.
Supplemental Material
Download Zip (24.1 KB)Data availability statement
Nm-nano is available at the Github repository https://github.com/Janga-Lab/Nm-Nano. The directRNA-sequencing data generated in this study for HEK293, and HeLa cell lines are publicly available on SRA, under the project accession PRJNA685783 and PRJNA604314, respectively.