
Figures & data
Table 1. The clinical data of patients with bladder cancer.
Figure 1. NR2F1 expressed at a high level in BC tissues.
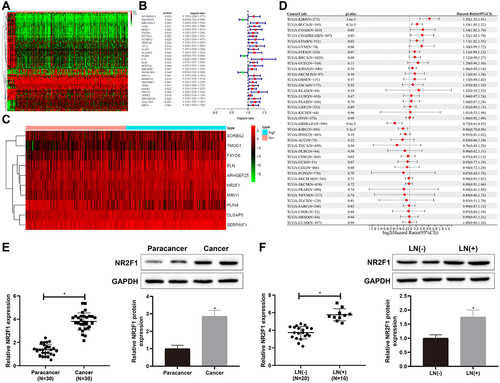
Figure 2. Low expression of NR2F1 suppressed inflammation and vascular mimicry in BC cells.
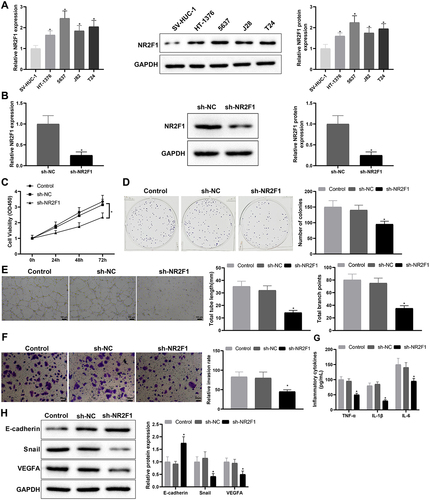
Figure 3. LINC00663 positively modulated NR2F1.
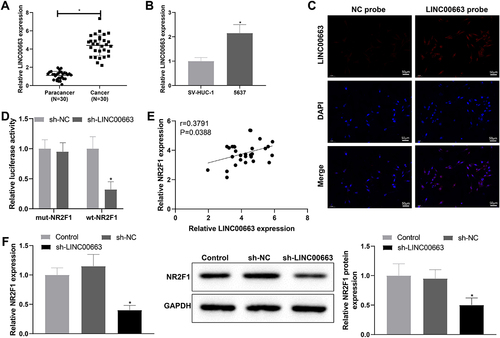
Figure 4. Knockdown of LINC00663 inhibited inflammation and vascular mimicry in BC cells by decreasing NR2F1 expression.
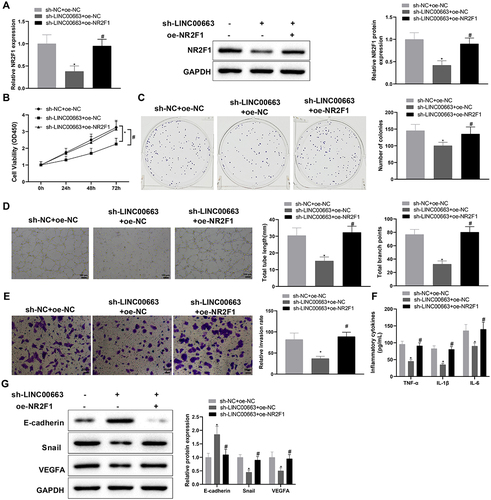
Figure 5. LINC00663 modulated NR2F1 expression through EBF1 and affected inflammation and vascular mimicry in BC cells.
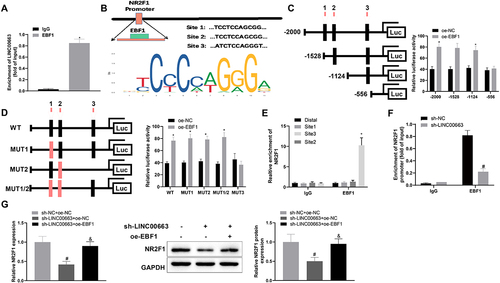
Figure 5. (Continued). (A) RIP assay was used to verify the binding between LINC00663 and EBF1. (B) the binding sites between EBF1 and NR2F1 were predicted by the JASPAR website. (C-E) the binding relationship between EBF1 and NR2F1 was verified by dual-luciferase reporter gene assay and ChIP assay (groups of site 1/2/3 referred to qPCR primers designed according to sequences of site 1/2/3 of NR2F1). (F) the binding between LINC00663 and NR2F1 was verified by ChIP assay. After BC cells were transfected with sh-LINC00663 and oe-EBF1, (G) the expression of NR2F1 was measured by qRT-PCR and western blot. (HI) cell proliferation was tested by CCK-8 and colony-forming assays. (J) the ability of vascular mimicry was examined by tube formation experiments. (K) cell invasion was measured by transwell assay. (L) the levels of TNF-α, IL-6, and IL-1β were measured by ELISA. (M) the expression of Snail, E-cadherin, and VEGFA was examined by western blot. Data were exhibited as mean ± standard deviation, and each experiment was run in triplicate. *p < 0.05, compared with IgG, oe-NC, or Distal group; #p < 0.05, compared with sh-NC or sh-NC + oe-NC group; &p < 0.05, compared with the sh-LINC00663 + oe-NC group. BC, bladder cancer.
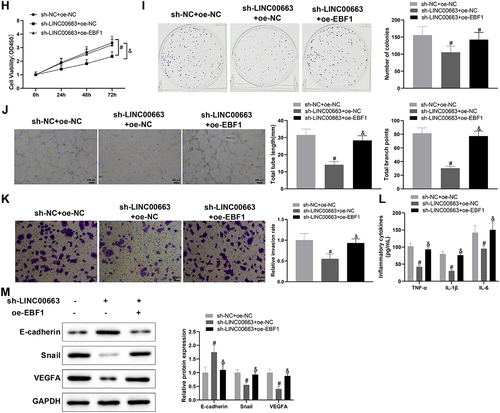
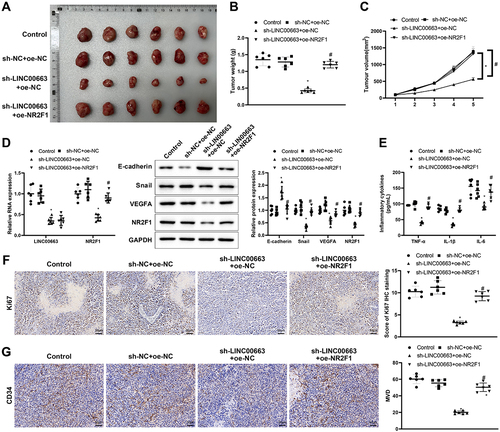
Figure 6. Silencing LINC00663 repressed tumour growth by reducing NR2F1 expression.
Supplementary Table 2.pdf
Download PDF (49.5 KB)Supplementary Table 1.pdf
Download PDF (39.8 KB)Supplementary Table 3.pdf
Download PDF (10.7 KB)Data availability statement
The datasets used or analysed during the current study are available from the corresponding author on reasonable request.