406
Views
1
CrossRef citations to date
0
Altmetric
Research Article

Altered Splenocyte Function in Aged C57BL/6 Mice Prenatally Exposed to Diethylstilbestrol

, , , , , & show all
Pages 221-229 | Received 20 May 2005, Accepted 15 Aug 2005, Published online: 09 Oct 2008

Figures & data

TABLE 1 Effects of DES on body weight and organ weight

FIG. 1. IFNγ levels in serum 6 hours after administration of soluble T. gondii protein. C57BL/6 mice were exposed to either DES (0.25 μg) (nfemale = 7, nmale = 11) or oil (nfemale = 10, nmale = 8) during prenatal development. One year later, mice were given 1 subcutaneous injection of DES (30 μg/kg BW). Mice were then challenged with 20 μg of soluble proteins derived from the R.H. strain of T. gondii. Serum samples were collected 6 hours after the T. gondii antigen administration. Mean data are presented in pg/ml ± SEM. Differences between genders and treatment groups were considered significant when p < 0.05. a denotes significant difference between females given prenatal oil and females given prenatal DES treatment. b denotes significant difference between females given prenatal DES and males given prenatal DES treatment.
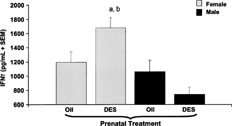
FIG. 1. IFNγ levels in serum 6 hours after administration of soluble T. gondii protein. C57BL/6 mice were exposed to either DES (0.25 μg) (nfemale = 7, nmale = 11) or oil (nfemale = 10, nmale = 8) during prenatal development. One year later, mice were given 1 subcutaneous injection of DES (30 μg/kg BW). Mice were then challenged with 20 μg of soluble proteins derived from the R.H. strain of T. gondii. Serum samples were collected 6 hours after the T. gondii antigen administration. Mean data are presented in pg/ml ± SEM. Differences between genders and treatment groups were considered significant when p < 0.05. a denotes significant difference between females given prenatal oil and females given prenatal DES treatment. b denotes significant difference between females given prenatal DES and males given prenatal DES treatment.

FIG. 2. IgG levels in serum six hours after T. gondii antigen administration. C57BL/6 mice were exposed to either DES (0.25 μg) (nfemale = 7, nmale = 11) or oil (nfemale = 10, nmale = 8) during prenatal development. One year later, mice were given one subcutaneous injection of (30 μg/kg bw). Mice were then challenged with 20 μg of soluble protein antigen derived from the R.H. strain of T. gondii. Serum samples were collected 6 hours after the T. gondii antigen administration. Mean data are presented in pg/ml ± SEM. Differences between genders and treatment groups were considered significant when p < 0.05. a denotes significant difference between females given DES and females given oil prenatal treatment (p = 0.001).
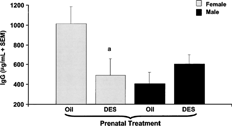
FIG. 2. IgG levels in serum six hours after T. gondii antigen administration. C57BL/6 mice were exposed to either DES (0.25 μg) (nfemale = 7, nmale = 11) or oil (nfemale = 10, nmale = 8) during prenatal development. One year later, mice were given one subcutaneous injection of (30 μg/kg bw). Mice were then challenged with 20 μg of soluble protein antigen derived from the R.H. strain of T. gondii. Serum samples were collected 6 hours after the T. gondii antigen administration. Mean data are presented in pg/ml ± SEM. Differences between genders and treatment groups were considered significant when p < 0.05. a denotes significant difference between females given DES and females given oil prenatal treatment (p = 0.001).

FIG. 3. Secreted IFNγ levels after 24 hour stimulation with ConA. C57BL/6 mice were exposed to either DES (0.25 μg) (nfemale = 7, nmale = 11) or oil (nfemale = 10, nmale = 8) during prenatal development. At 1 year of age, all mice were given 30 μg DES/kg BW. Two months later, mice were euthanized to collect splenocytes. Splenocytes were cultured with an optimal concentration of ConA (10 μg/ml). The supernatants were collected after 24 hours of culture and analyzed for IFNγ levels by ELISA. Mean data are represented in pg/ml ± SEM. Differences between gender and prenatal treatments were considered significant when p < 0.05. a denotes significant difference between females given DES and females given oil prenatal treatment.
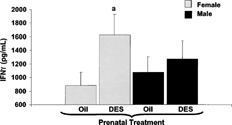
FIG. 3. Secreted IFNγ levels after 24 hour stimulation with ConA. C57BL/6 mice were exposed to either DES (0.25 μg) (nfemale = 7, nmale = 11) or oil (nfemale = 10, nmale = 8) during prenatal development. At 1 year of age, all mice were given 30 μg DES/kg BW. Two months later, mice were euthanized to collect splenocytes. Splenocytes were cultured with an optimal concentration of ConA (10 μg/ml). The supernatants were collected after 24 hours of culture and analyzed for IFNγ levels by ELISA. Mean data are represented in pg/ml ± SEM. Differences between gender and prenatal treatments were considered significant when p < 0.05. a denotes significant difference between females given DES and females given oil prenatal treatment.
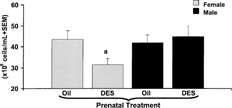
FIG. 4. Splenic lymphocyte count of adult C57BL/6 mice prenatally exposed to oil or DES treatment. C57BL/6 mice were exposed to either DES (0.25 μg) (nfemale = 7, nmale = 11) or oil (nfemale = 10, nmale = 8) during prenatal development. At 1 year of age, all mice were given 30 μg DES/kg BW. Immediately after harvesting the spleen, splenocyte suspensions were counted on a CASY-1 Cell Counter and Analyzer System (Scharfe System GmbH, Reutingen, Germany). Data presented as mean cellularity ± SEM. Differences between gender and prenatal treatments were considered significant when p < 0.05. a denotes significant difference between females given DES and females given oil prenatal treatment.

FIG. 4. Splenic lymphocyte count of adult C57BL/6 mice prenatally exposed to oil or DES treatment. C57BL/6 mice were exposed to either DES (0.25 μg) (nfemale = 7, nmale = 11) or oil (nfemale = 10, nmale = 8) during prenatal development. At 1 year of age, all mice were given 30 μg DES/kg BW. Immediately after harvesting the spleen, splenocyte suspensions were counted on a CASY-1 Cell Counter and Analyzer System (Scharfe System GmbH, Reutingen, Germany). Data presented as mean cellularity ± SEM. Differences between gender and prenatal treatments were considered significant when p < 0.05. a denotes significant difference between females given DES and females given oil prenatal treatment.

TABLE 2 Percent expression of CD4 and CD8 splenocytes from DES or oil prenatally exposed mice immediately after harvest

FIG. 5. CD28+ CD90+ unstimulated and ConA stimulated splenocytes from female mice given prenatal oil or DES treatment. C57BL/6 mice were exposed to either DES (0.25 μg) (nfemale = 6) or oil (nfemale = 6) during prenatal development. At 1 year of age, all mice were given 30 μg DES/kg BW. Splenocytes were stained for CD28 co-stimulatory marker expressed on T-cells (CD90). The top panel () shows representative data of female splenocytes. The bottom panel () shows data presented as mean ± SEM of CD28 expression on T-cells cultured in the presence or absence of ConA for 24 hours in female mice. Differences between prenatal treatments were considered significant when p < 0.05. The relative percentages of CD28 expression on T-cells in media cultures included (Femaleoil = 49.4 ± 7.7, FemaleDES = 40.7 ± 7.1, Maleoil = 49.4 ± 7.0, MaleDES = 48.5± 7.3). a denotes significant difference between cultured splenocytes stimulated with ConA from females given DES and females given prenatal treatment.
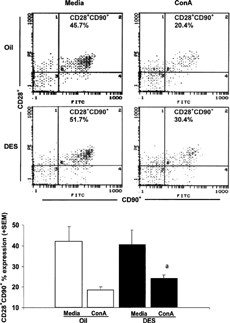
FIG. 5. CD28+ CD90+ unstimulated and ConA stimulated splenocytes from female mice given prenatal oil or DES treatment. C57BL/6 mice were exposed to either DES (0.25 μg) (nfemale = 6) or oil (nfemale = 6) during prenatal development. At 1 year of age, all mice were given 30 μg DES/kg BW. Splenocytes were stained for CD28 co-stimulatory marker expressed on T-cells (CD90). The top panel (Figure 5A) shows representative data of female splenocytes. The bottom panel (Figure 5B) shows data presented as mean ± SEM of CD28 expression on T-cells cultured in the presence or absence of ConA for 24 hours in female mice. Differences between prenatal treatments were considered significant when p < 0.05. The relative percentages of CD28 expression on T-cells in media cultures included (Femaleoil = 49.4 ± 7.7, FemaleDES = 40.7 ± 7.1, Maleoil = 49.4 ± 7.0, MaleDES = 48.5± 7.3). a denotes significant difference between cultured splenocytes stimulated with ConA from females given DES and females given prenatal treatment.

TABLE 3 Relative percentages of CD4+CD25+ splenocytes after 24-hour incubation from female and male mice exposed to either oil or DES prenatally

Reprints and Corporate Permissions

Please note: Selecting permissions does not provide access to the full text of the article, please see our help page How do I view content?

To request a reprint or corporate permissions for this article, please click on the relevant link below:

Academic Permissions

Please note: Selecting permissions does not provide access to the full text of the article, please see our help page How do I view content?

Obtain permissions instantly via Rightslink by clicking on the button below:

If you are unable to obtain permissions via Rightslink, please complete and submit this Permissions form. For more information, please visit our Permissions help page.