Figures & data
TABLE 1 List of primers used for semi-quantitative RT-PCR
TBALE 2 Up- and down-regulated gene in mouse fetal thymus exposed to DEP extracts
FIG. 1 Venn diagram of DEP extracts and AhR ligand (TCDD and B[a]P)-regulated genes. Fetal thymus was exposed to DEP extracts, TCDD, or B[a]P for 24 hrs. Total RNA was isolated and gene expression was analyzed using an Affymetrix GeneChip. These genes showed at least a 2-fold change in expression in both of two independent experiments, compared to controls.
![FIG. 1 Venn diagram of DEP extracts and AhR ligand (TCDD and B[a]P)-regulated genes. Fetal thymus was exposed to DEP extracts, TCDD, or B[a]P for 24 hrs. Total RNA was isolated and gene expression was analyzed using an Affymetrix GeneChip. These genes showed at least a 2-fold change in expression in both of two independent experiments, compared to controls.](/cms/asset/92cb733f-c292-4f45-af7f-99bea13b313d/iimt_a_149611_uf0001_b.gif)
FIG. 2 Confirmation of gene chip data in fetal thymuses exposed to DEP extracts, TCDD, and B[a]P using semi-quantitative RT-PCR. Fetal thymus was exposed to DEP extracts, TCDD, or B[a]P for 24 hrs, and ds-cDNAs obtained in two independent experiments were subjected to semi-quantitative PCR using each specific primer pair (). PCR products were separated in a 1.2% SYNER gel containing 0.5 μg/ml ethidium bromide.
![FIG. 2 Confirmation of gene chip data in fetal thymuses exposed to DEP extracts, TCDD, and B[a]P using semi-quantitative RT-PCR. Fetal thymus was exposed to DEP extracts, TCDD, or B[a]P for 24 hrs, and ds-cDNAs obtained in two independent experiments were subjected to semi-quantitative PCR using each specific primer pair (Table 1). PCR products were separated in a 1.2% SYNER gel containing 0.5 μg/ml ethidium bromide.](/cms/asset/f90ada9c-fc1e-41d2-bf88-1b79595dddb3/iimt_a_149611_uf0002_b.gif)
FIG. 3 Venn diagram of DEP extracts and quinones (NPQ and PHQ)-regulated genes. Fetal thymus was exposed to DEP extracts, NPQ, or PHQ for 24 hours. Total RNA was isolated and gene expression was analyzed using an Affymetrix GeneChip. These genes showed at least a 2-fold change in expression in both of two independent experiments, compared to controls.
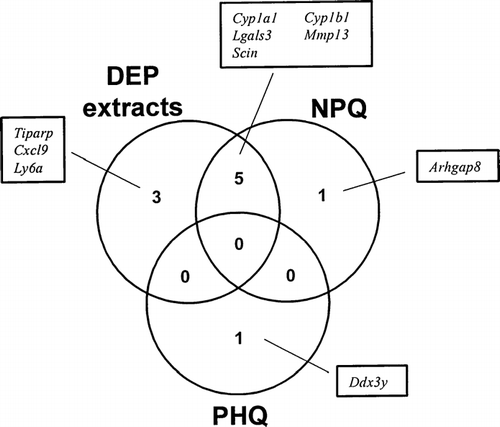
FIG. 4 Confirmation of gene chip data in fetal thymuses exposed to DEP extracts, NPQ, and PHQ using semi-quantitative RT-PCR. Fetal thymus was exposed to DEP extracts, NPQ, or PHQ for 24 hrs, and ds-cDNAs obtained in two independent experiments were subjected to semi-quantitative PCR using each specific primer pair (). PCR products were separated in a 1.2% SYNER gel containing 0.5 μg/ml ethidium bromide.
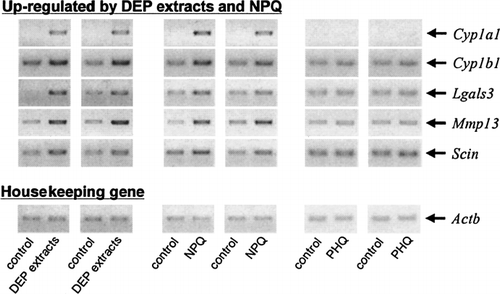
FIG. 5 Measurement of the mRNA expression of stress response genes using semi-quantitative RT-PCR. Ds-cDNAs of stress response genes (Nqo1 and Hmox1) were amplified using semi-quantitative PCR and visualized using ethidium bromide. Ds-cDNAs were identical to the samples used in the Affymetrix GeneChip analysis ( and ).
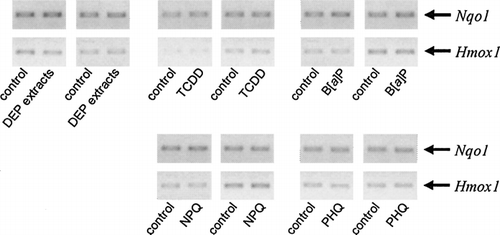
FIG. 6 Hierarchical clustering analysis of the genes that were either up- or down-regulated by a 24 hr exposure to DEP extracts or their constituents. Values obtained from Affymetrix GeneChip analysis were normalized using the mean of the vehicle-treated controls (cream color), and hierarchical clustering was performed using GeneSpring. The results are presented as the mean of ratio of the signal intensities from two independent experiments. Up-regulated genes appear red while down-regulated genes appear blue.
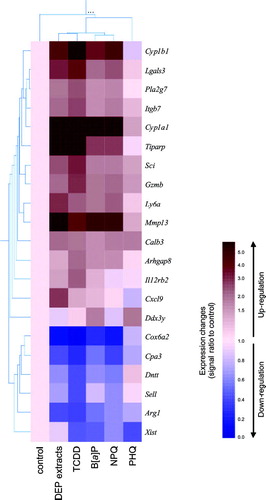
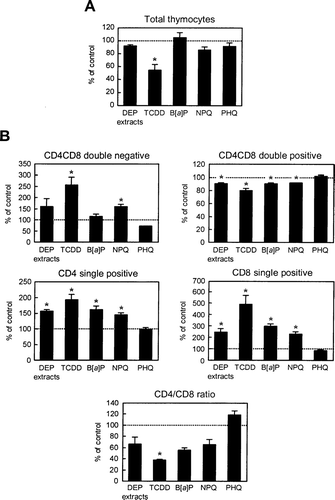
FIG. 7 Effects of DEP extracts or their constituents on thymocyte cellularity. Fetal thymus was exposed to DEP extracts or the described chemicals for 4 days and thymocyte cell numbers (A) and subset populations (B) were examined. The data are expressed as the mean percent of control ± SEM (n = 3), compared to control. Asterisk indicates statistically significant difference (p < 0.05) from the corresponding control.