Figures & data
FIG. 1 Increased Tissue Weight Following Immunostimulatory ODN Treatment. Female mice were administered 50 mg/kg ISIS 2302 (q2d, sc) for 1 or 3 wk or 4 mg/kg ISIS 12449 as a single dose (S) or multiple dose (M; q2d for 1 wk). Liver and spleen weights were normalized as percent body weight and then expressed as fold change from the PBS control group. The insert table represents the cumulative dose of ODN exposure and the effect on organ weight. N = 4–8. aDenotes significant difference from PBS control. bDenotes significant difference from all groups.
FIG. 2 Immune Cell Infiltrates in Liver Following Immunostimulatory ODN Treatment. Female mice were administered 50 mg/kg ISIS 2302 (q2d, sc) for 1 or 3 wk or 4 mg/kg ISIS 12449 as a single dose (S) or multiple dose (M; q2d for 1 wk). Liver was fixed in 10% formalin and sections were stained with Hemotoxilin/Eosin. The panels are representative photomicrographs of each treatment group: A, PBS; B, ISIS 2302 (1 wk); C, ISIS 2302 (3 wk); D, ISIS 12449 S; E, ISIS 12449 M.
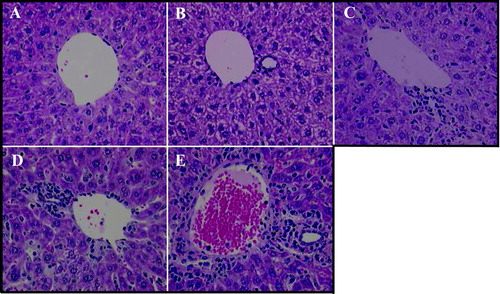
FIG. 3 Immunohistochemical Detection of Histocyte Cell Markers Lysozyme and CD 115. Female mice were administered 4 mg/kg ISIS 12449 as a single dose (S) for 1 wk. Liver was frozen in OCT and sections were incubated with the primary antibodies lysozyme (Panel A,B) or CD115 (Panel C,D) and then with a HRP-labeled secondary antibody. Peroxidase specific staining is indicated by the dark brown staining. The panels are representative photomicrographs of each treatment group: A, C, PBS; B, D ISIS 12449S.
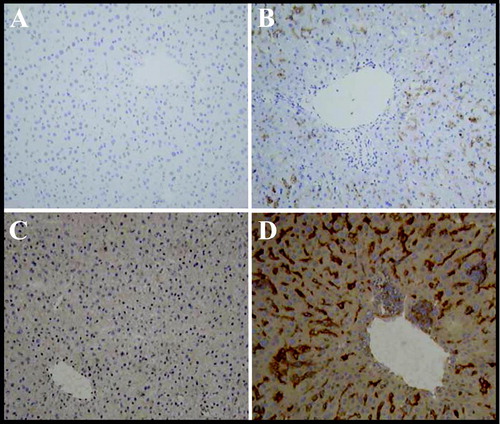
FIG. 4 Gene Microarray Analysis of Non-Parenchymal Liver Cells and Peripheral Blood Leukocytes Following Immunostimulatory ODN Treatment. Female mice were administered 50 mg/kg ISIS 2302 (q2d, sc) for 1 or 3 wk or 4 mg/kg ISIS 12449 as a single dose (S) or multiple dose (M; q2d for 1 wk). Whole blood was harvested for collection of leukocytes while the non-parenchymal cells were isolated from the liver. Total RNA from these tissue fractions was subjected to oligoarray analysis as detailed in Materials and Methods. Genes are categorized into five groups and data is represented as fold change from PBS control. (A) Data obtained from non-parenchymal liver cells, N = 4; (B) data obtained from peripheral blood leukocytes. *Denotes significant difference from PBS control.
FIG. 5 Gene Microarray Analysis Across Tissues. Female mice were administered 4 mg/kg ISIS 12449 q2d for 1 wk. Whole blood was harvested for collection of leukocytes while the non-parenchymal cells were isolated from the liver. Total RNA from these tissue fractions as well as from whole liver was subjected to oligoarray analysis as detailed in Materials and Methods. A selected list of genes are shown and represented as fold change from PBS control. *Denotes significant difference from PBS control.
TABLE 1 Comparing gene array and RT-PCR analysis on liver and peripheral blood leukocytes for specific genes of interest following immunostimulatory ODN treatment