Figures & data
FIG. 1 Serum corticosterone concentrations over time in rats exposed to stressors. Rats were stressed beginning at time 0, and blood samples were collected from tail at the indicated times after initiation of stressor. For experiments 5 and 6, stress was administered daily for 3 or 4 days, and corticosterone values were determined on the last day. Values shown represent means ± SEM and n = 5–6 per group. The numbers shown below each legend are the area under the corticosterone concentration vs. time curve (AUC), and these values provide a quantitative measure of excessive corticosterone exposure. Of course, the values in Experiments 5 and 6 do not reflect corticosterone produced on previous days of treatment. The AUC value in Experiment 6 was slightly less than 0, indicating that the rats had habituated to restraint stress by day 3, and no longer responded to this stressor.
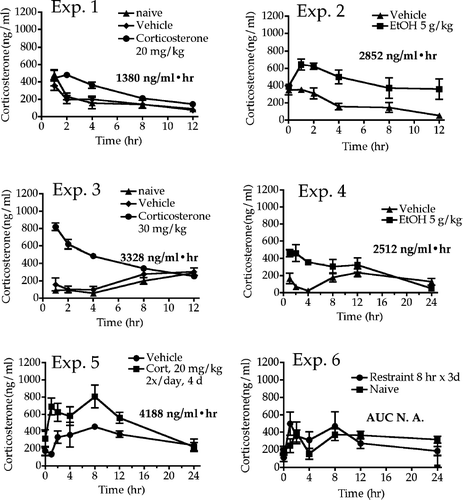
FIG. 2 Changes in the concentration of various blood cell types at 12 hr (for Experiments 1 and 2) or 24 hr (Experiments 3–6) after initiation of stressor. Values shown are means ± SEM for groups of 5–6 rats, and values in each experiment significantly different from the control value are indicated by * p < 0.05 or ** p < 0.01. In some experiments some parameters were not measured (indicated by N.D., not determined).
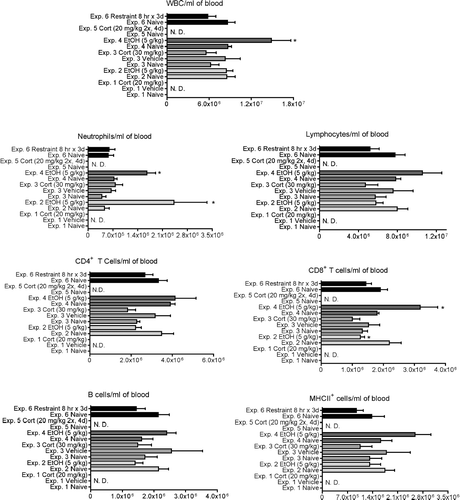
FIG. 3 Changes in the percentage of various blood cell types at 12 hr (for Experiments 1 and 2) or 24 hr (Experiments 3–6) after initiation of stressor. Values shown are means ± SEM for groups of 5-6 rats, and values in each experiment significantly different from the control value are indicated by * p < 0.05 or * p < 0.01.
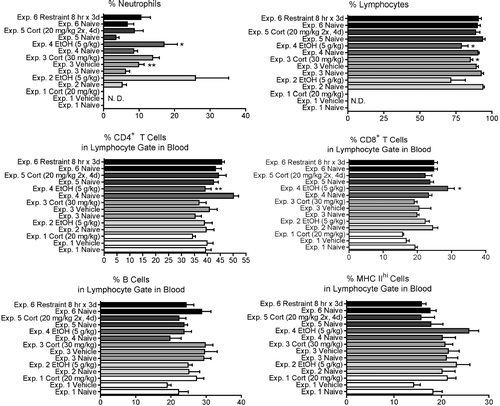
FIG. 4 Changes in the spleen 12 hr (for Experiments 1 and 2) or 24 hr (for Experiments 3–6) after initiation of stressor. Values shown are means ± SEM for groups of 5–6 rats, and values in each experiment significantly different from the control value are indicated by * p < 0.05, or ** p < 0.01.
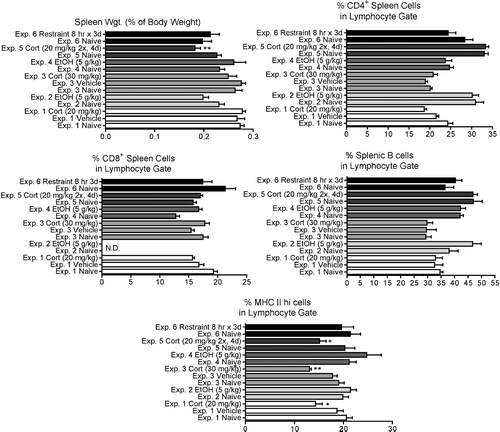
FIG. 5 Histological changes in the spleen and thymus in response to stressors. A, B: Spleen from a control rat from Experiment 2 (H&E and immunohistochemistry [IHC] for CD79a, 100X). C, D: Spleen from a treated Experiment 2 rat with decreased size and cellularity of the B-cell areas, including marginal zone (mz) (H&E and IHC for CD79a). E: Thymus from a treated Experiment 2 rat, showing increased numbers of macrophages containing apoptotic cell debris (H&E, 200X). F: Thymus from a control Experiment 2 rat, showing the normal density of apoptotic cells (IHC for cleaved caspase-3, 200X). G: Thymus from the same rat as in E, showing markedly increased positivity for cleaved caspase-3 (IHC for cleaved caspase-3, 200X). H: Thymus from a control Experiment 5 rat, showing the normal size and cellularity of cortex and medulla (H&E, 100X). I: Thymus from a treated Experiment 5 rat, showing marked thinning and depletion of lymphocytes in the cortical areas (H&E, 100X).
![FIG. 5 Histological changes in the spleen and thymus in response to stressors. A, B: Spleen from a control rat from Experiment 2 (H&E and immunohistochemistry [IHC] for CD79a, 100X). C, D: Spleen from a treated Experiment 2 rat with decreased size and cellularity of the B-cell areas, including marginal zone (mz) (H&E and IHC for CD79a). E: Thymus from a treated Experiment 2 rat, showing increased numbers of macrophages containing apoptotic cell debris (H&E, 200X). F: Thymus from a control Experiment 2 rat, showing the normal density of apoptotic cells (IHC for cleaved caspase-3, 200X). G: Thymus from the same rat as in E, showing markedly increased positivity for cleaved caspase-3 (IHC for cleaved caspase-3, 200X). H: Thymus from a control Experiment 5 rat, showing the normal size and cellularity of cortex and medulla (H&E, 100X). I: Thymus from a treated Experiment 5 rat, showing marked thinning and depletion of lymphocytes in the cortical areas (H&E, 100X).](/cms/asset/72a26ef5-2c78-4647-968e-0cc684903f69/iimt_a_211450_uf0005_b.gif)
FIG. 6 Changes in the thymus 12 hr (for Experiments 1 and 2) or 24 hr (for Experiments 3–6) after initiation of stressor. Values shown are means ± SEM for groups of 5–6 rats, and values in each experiment significantly different from the control value are indicated by * p < 0.05, ** p < 0.01, or *** p < 0.001.
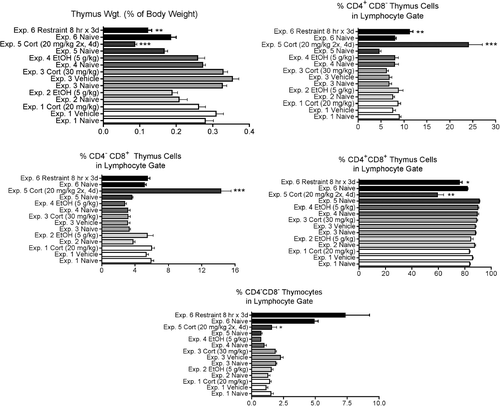
FIG. 7 Relationships between area under the corticosterone concentration vs. time curve (AUC) and selected immunological endpoints. The results shown are means ± SEM for groups of 5–6 rats and represent results from Experiments 3, 4, and 5. The first point in each graph represents the normalized value of the control group (all control groups were arbitrarily defined as 100%). These are the experiments in which the endpoints were evaluated 24 hr after stressor initiation, but Experiment 6 was not included. In that experiment, the daily restrains sessions apparently produced habituation, leading to lack of a corticosterone response after the last restraint session. Also note that the results for Experiment 5 (AUC = 4188) may represent some degree of cumulative effects, because the rats in this experiment were treated daily for 4 days with exogenous corticosterone. The lines shown are the best fit to the data as indicated by analysis with Prism software.
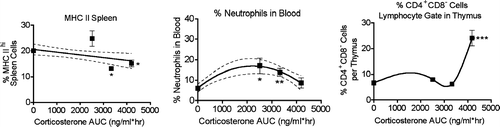
FIG. 8 Comparison of stress effects in mice and rats on the basis of corticosterone AUC values. Results for rats are from the present study, and results for mice are from previous studies. Some of these results have been published previously (Schwab et al., Citation2005), but the values are not the same as shown here. For the present study, the raw flow cytometry data from mice were reanalyzed using a gating scheme as similar as possible to the one used here for rats. In the published study (Schwab et al., Citation2005), significantly different gating was used, and this produced different values. The times indicated are the times after initiation of stressor at which the parameter was analyzed. Results shown are means ± SEM and are normalized by defining the control value of each experiment as 100%. Values that differed significantly from the control within each experiment are indicated by * p < 0.05, ** p < 0.01, or *** p < 0.001.
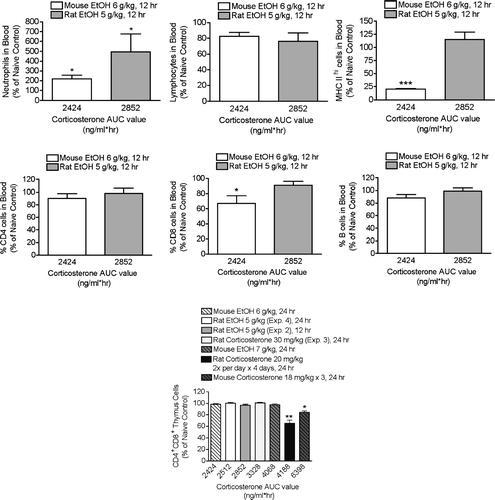
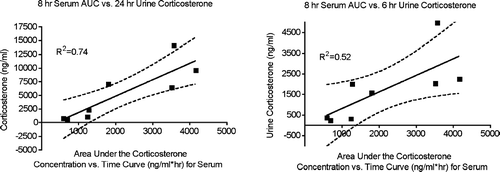
FIG. 9 Relationships between area under the corticosterone concentration vs. time curve (AUC) for serum and urine corticosterone concentration. The results shown are means for groups of 5–6 rats treated with exogenous corticosterone or untreated. The linear relationship, 95% confidence intervals, and R2 values are shown.