3,601
Views
18
CrossRef citations to date
0
Altmetric
Research Article

Use of Whole Sheep Red Blood Cells in ELISA to Assess Immunosuppression In Vivo

, , &
Pages 77-82 | Received 14 Aug 2006, Accepted 15 Nov 2006, Published online: 09 Oct 2008

Figures & data

FIG. 4 Effect of immunosuppressive agents on IgM antibody response to SRBC. Rats were treated orally with cyclophosphamide, cyclosporine, prednisolone, or methotrexate for 14 consecutive days. Serum samples were collected at Day 15. The vertical axis shows the serum IgM titer required to yield a value of OD = 1.0. Each bar represents the mean ± SE of 10 animals. Asterisks indicate the value is significantly different from SRBC-immunized vehicle control group (*p < 0.05; ** p < 0.01).
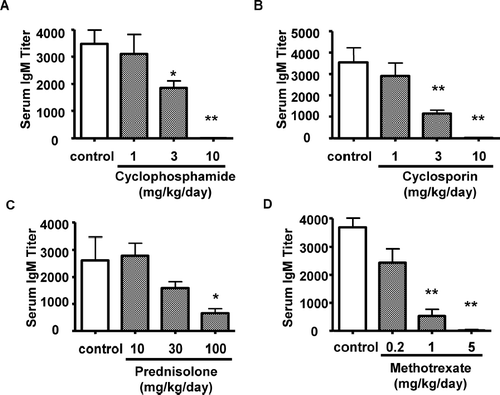
FIG. 4 Effect of immunosuppressive agents on IgM antibody response to SRBC. Rats were treated orally with cyclophosphamide, cyclosporine, prednisolone, or methotrexate for 14 consecutive days. Serum samples were collected at Day 15. The vertical axis shows the serum IgM titer required to yield a value of OD = 1.0. Each bar represents the mean ± SE of 10 animals. Asterisks indicate the value is significantly different from SRBC-immunized vehicle control group (*p < 0.05; ** p < 0.01).

FIG. 1 Change in the number of cells attached to the plate during ELISA. Each bar indicates the mean ± SD.
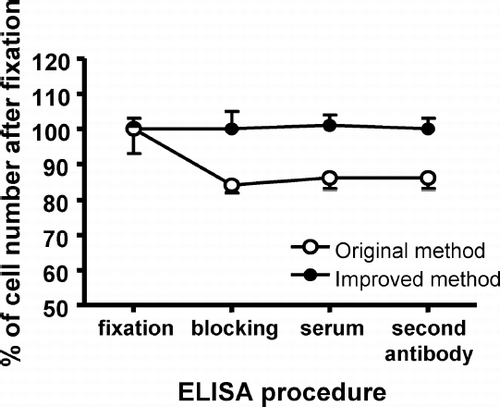
FIG. 1 Change in the number of cells attached to the plate during ELISA. Each bar indicates the mean ± SD.

FIG. 2 Titration curve of anti-SRBC antibodies. IgM (A) and IgG (B) in rats and IgM (C) in mice. Negative control sera were showed open symbols and positive control sera were showed closed symbols. For positive control, pooled anti-sera for IgM and IgG were collected at Days 6 and 14 after immunization (rats: 3× 10⁸ cells, intravenously. and mice: 5 × 10⁸ cells, intraperitoneally). IgM and IgG antibody levels were determined using the whole SRBC-ELISA.
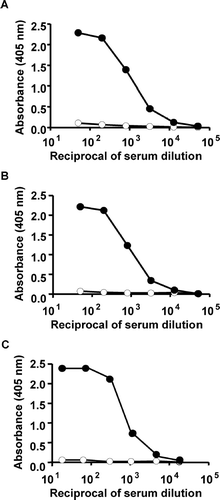
FIG. 2 Titration curve of anti-SRBC antibodies. IgM (A) and IgG (B) in rats and IgM (C) in mice. Negative control sera were showed open symbols and positive control sera were showed closed symbols. For positive control, pooled anti-sera for IgM and IgG were collected at Days 6 and 14 after immunization (rats: 3× 10⁸ cells, intravenously. and mice: 5 × 10⁸ cells, intraperitoneally). IgM and IgG antibody levels were determined using the whole SRBC-ELISA.

FIG. 3 Potential effect of lot differences in SRBC used for ELISA on IgM antibody response to SRBC. The sera (n = 15/group) were collected at Day 6 after immunization with 3× 10⁸ SRBC of Lot X. IgM antibody levels were determined by whole SRBC-ELISA of Lots X, A, B, and C, respectively. The bar indicates average in each group.
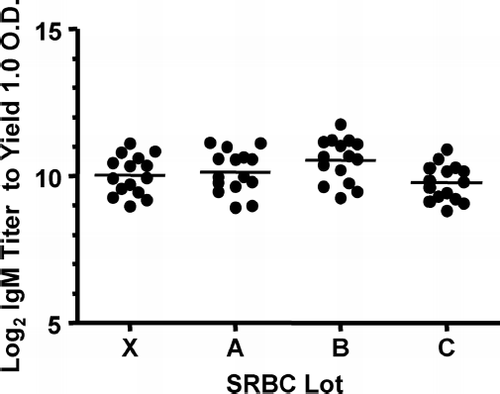
FIG. 3 Potential effect of lot differences in SRBC used for ELISA on IgM antibody response to SRBC. The sera (n = 15/group) were collected at Day 6 after immunization with 3× 10⁸ SRBC of Lot X. IgM antibody levels were determined by whole SRBC-ELISA of Lots X, A, B, and C, respectively. The bar indicates average in each group.

Reprints and Corporate Permissions

Please note: Selecting permissions does not provide access to the full text of the article, please see our help page How do I view content?

To request a reprint or corporate permissions for this article, please click on the relevant link below:

Academic Permissions

Please note: Selecting permissions does not provide access to the full text of the article, please see our help page How do I view content?

Obtain permissions instantly via Rightslink by clicking on the button below:

If you are unable to obtain permissions via Rightslink, please complete and submit this Permissions form. For more information, please visit our Permissions help page.