822
Views
12
CrossRef citations to date
0
Altmetric
Select Reports from the Immunotoxicology IV Conference, Washington, DC

Urinary Corticosterone as an Indicator of Stress-Mediated Immunological Changes in Rats

, , , &
Pages 17-22 | Received 30 Jan 2007, Accepted 11 May 2007, Published online: 09 Oct 2008

Figures & data

FIG. 1 Relationship between urine corticosterone and neutrophil differential count in the blood. Values for both parameters were normalized by expressing control values as 100% and comparing the values for treated animals to this value. Each symbol represents the mean values for one group of rats (4–7 rats per group, see Materials and Methods). Symbols of the same type indicate groups from a particular experiment. The linear model was derived and r-squared values calculated using Prism 4.0 software (GraphPad, San Diego).
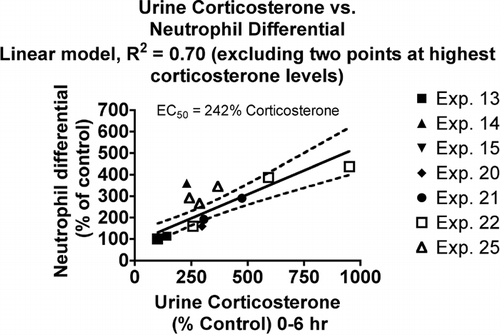
FIG. 1 Relationship between urine corticosterone and neutrophil differential count in the blood. Values for both parameters were normalized by expressing control values as 100% and comparing the values for treated animals to this value. Each symbol represents the mean values for one group of rats (4–7 rats per group, see Materials and Methods). Symbols of the same type indicate groups from a particular experiment. The linear model was derived and r-squared values calculated using Prism 4.0 software (GraphPad, San Diego).

FIG. 2 Relationship between urine corticosterone and lymphocyte differential count in the blood. Values for both parameters were normalized by expressing control values as 100% and comparing the values for treated animals to this value. Each symbol represents the mean values for one group of rats (4–7 rats per group, see Materials and Methods). Symbols of the same type indicate groups from a particular experiment. The linear model was derived and r-squared values calculated using Prism 4.0 software.
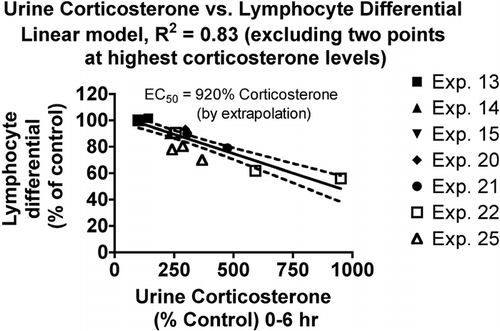
FIG. 2 Relationship between urine corticosterone and lymphocyte differential count in the blood. Values for both parameters were normalized by expressing control values as 100% and comparing the values for treated animals to this value. Each symbol represents the mean values for one group of rats (4–7 rats per group, see Materials and Methods). Symbols of the same type indicate groups from a particular experiment. The linear model was derived and r-squared values calculated using Prism 4.0 software.
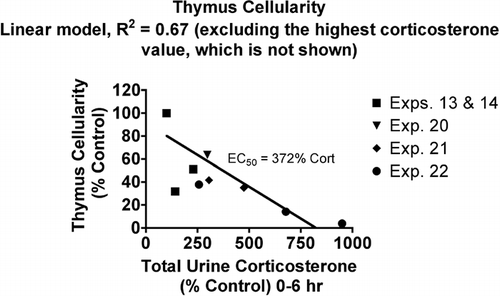
FIG. 3 Relationship between urine corticosterone and thymus cellularity. Values for both parameters were normalized by expressing control values as 100% and comparing the values for treated animals to this value. Each symbol represents the mean values for one group of rats (4–7 rats per group, see Materials and Methods). Symbols of the same type indicate groups from a particular experiment. The linear model was derived and r-squared values calculated using Prism 4.0 software.
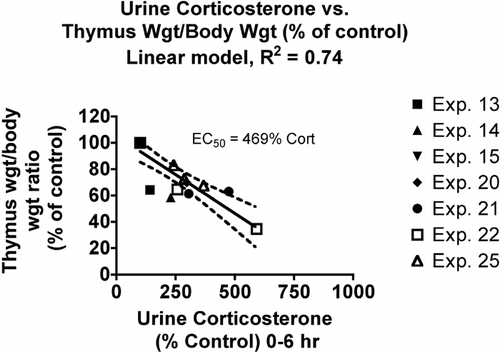
FIG. 3 Relationship between urine corticosterone and thymus cellularity. Values for both parameters were normalized by expressing control values as 100% and comparing the values for treated animals to this value. Each symbol represents the mean values for one group of rats (4–7 rats per group, see Materials and Methods). Symbols of the same type indicate groups from a particular experiment. The linear model was derived and r-squared values calculated using Prism 4.0 software.
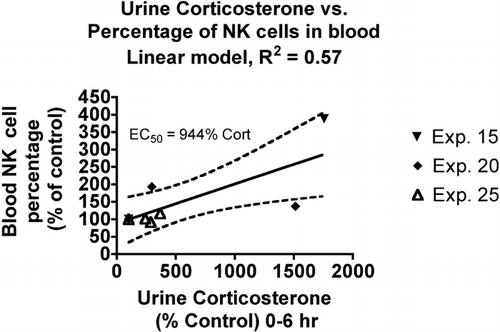
FIG. 4 Relationship between urine corticosterone and thymus weight to body weight ratio. Values for both parameters were normalized by expressing control values as 100% and comparing the values for treated animals to this value. Each symbol represents the mean values for one group of rats (4–7 rats per group, see Materials and Methods). Symbols of the same type indicate groups from a particular experiment. The linear model was derived and r-squared values calculated using Prism 4.0 software.

FIG. 4 Relationship between urine corticosterone and thymus weight to body weight ratio. Values for both parameters were normalized by expressing control values as 100% and comparing the values for treated animals to this value. Each symbol represents the mean values for one group of rats (4–7 rats per group, see Materials and Methods). Symbols of the same type indicate groups from a particular experiment. The linear model was derived and r-squared values calculated using Prism 4.0 software.

FIG. 5 Relationship between urine corticosterone and neutrophil differential count in the blood. Values for both parameters were normalized by expressing control values as 100% and comparing the values for treated animals to this value. Each symbol represents the mean values for one group of rats (4–7 rats per group, see Materials and Methods). Symbols of the same type indicate groups from a particular experiment. The linear model was derived and r-squared values calculated using Prism 4.0 software.

FIG. 5 Relationship between urine corticosterone and neutrophil differential count in the blood. Values for both parameters were normalized by expressing control values as 100% and comparing the values for treated animals to this value. Each symbol represents the mean values for one group of rats (4–7 rats per group, see Materials and Methods). Symbols of the same type indicate groups from a particular experiment. The linear model was derived and r-squared values calculated using Prism 4.0 software.

Reprints and Corporate Permissions

Please note: Selecting permissions does not provide access to the full text of the article, please see our help page How do I view content?

To request a reprint or corporate permissions for this article, please click on the relevant link below:

Academic Permissions

Please note: Selecting permissions does not provide access to the full text of the article, please see our help page How do I view content?

Obtain permissions instantly via Rightslink by clicking on the button below:

If you are unable to obtain permissions via Rightslink, please complete and submit this Permissions form. For more information, please visit our Permissions help page.