Figures & data
FIG. 1A Standardized Prevalence Ratio of PBC-OLT (A) and PSC-OLT (B) by zip code. Darker shading indicates a higher standardized prevalence ratio (spr). Thick black lines indicate the border between boroughs. Superfund sites are denoted by orange triangles. Statistically significant disease clusters associated with the location of Superfund sites in Staten Island are denoted by circles. PBC-OLT, PBC patients listed for liver transplantation; PSC-OLT, PSC patients listed for liver transplantation.
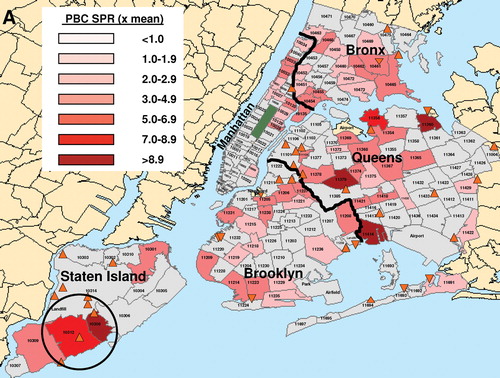
FIG. 1B Standardized Prevalence Ratio of PBC-OLT (A) and PSC-OLT (B) by zip code. Darker shading indicates a higher standardized prevalence ratio (spr). Thick black lines indicate the border between boroughs. Superfund sites are denoted by orange triangles. Statistically significant disease clusters associated with the location of Superfund sites in Staten Island are denoted by circles. PBC-OLT, PBC patients listed for liver transplantation; PSC-OLT, PSC patients listed for liver transplantation.
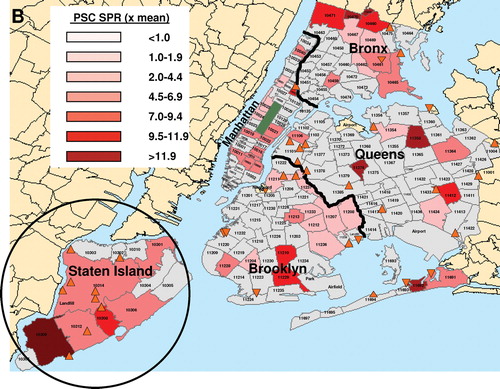
FIG. 2 Comparison of clusters of PBC patients listed for transplantation (PBC-OLT) and non-listed PBC patients (PBC-MSSM). Clusters of PBC-OLT and PBC-MSSM cases are denoted by solid and dashed circles, respectively. Of the PBC-OLT clusters, only the cluster in Staten Island was statistically significant. Thick black lines indicate the border between boroughs. Superfund sites are denoted by orange triangles.
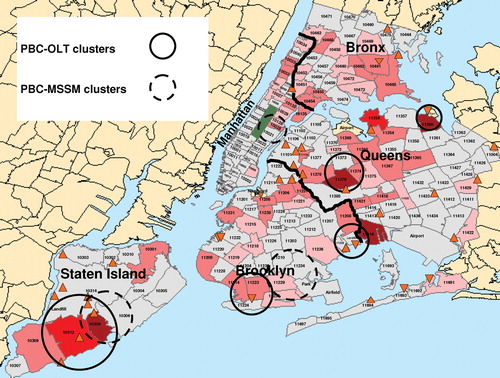
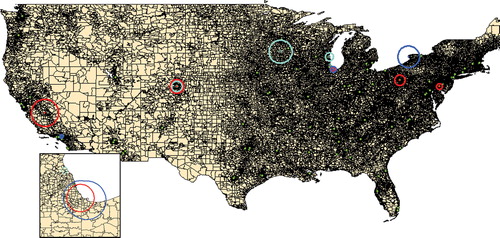
FIG. 3 Association of immune-mediated chronic liver disease and airborne chlorinated hydrocarbons. Focused cluster analysis using U.S. E.P.A. data to identify sites with the highest mean daily concentrations (90th percentile) of airborne chlorinated hydrocarbons was performed for PBC-OLT (blue), PSC-OLT (turquoise), and AIH-OLT (red) cases. Major cities within the cluster areas included Dover (AIH), Pittsburgh (AIH), Buffalo (PBC), Chicago/Gary (PSC, AIH, and PBC), Milwaukee (PSC), St. Paul/Rochester (PSC), Denver (AIH, PSC), Fresno (AIH) and Los Angeles (PBC). Green dots indicate the locations of adult liver transplantation centers. The inset map shows the Chicago/Gary area in greater detail.