Figures & data
Table 1. Concentrations for individual metals and metal combinations (μg/rat).
Figure 1. Percent (%) change in body weight post-infection of rats that were pre-exposed to individual soluble metals (A) or to soluble metal mixtures (B) 3 days prior to intratracheal inoculation with L. monocytogenes. Values are means ± SE (p < 0.05). : *significantly different from all groups; $significantly different from Soluble Fe and Saline groups. : asignificantly different from Saline and Mix - No Ni groups; bsignificantly different from Saline group; csignificantly different from Mix - No Ni group; dsignificantly different from Saline, Mix - No Ni, and Mix - No Zn groups.
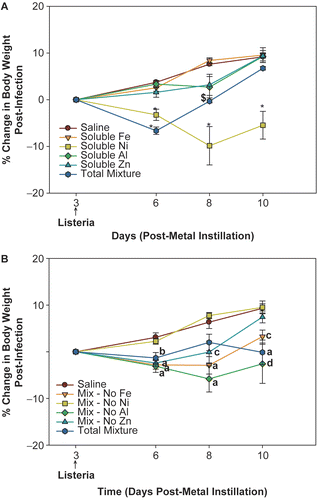
Table 2. Bacterial clearance after pre-exposure to individual metals.
Table 3. Bacterial clearance after pre-exposure to metal mixtures.
Figure 2. Lactate dehydrogenase (LDH) (A and B) and albumin (C and D) in the BAL fluid of rats that were pre-exposed to individual soluble metals or to soluble metal mixtures 3 days prior to intratracheal inoculation with L. monocytogenes. Values are means ± SE (p < 0.05). and : *significantly different from all groups; +significantly different from Saline, Soluble Fe, Soluble Al, and Soluble Zn groups. and :asignificantly different from Saline and Mix - No Ni groups (p < 0.05).
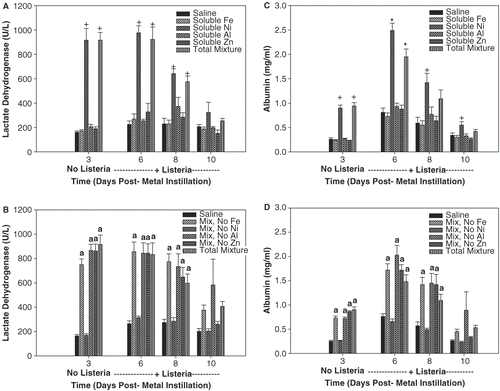
Figure 3. Totals AM (A and B) and total PMN (C and D) present in the BAL fluid of rats that were pre-exposed to individual soluble metals or to soluble metal mixtures 3 days prior to intratracheal inoculation with L. monocytogenes. Values are means ± SE (p < 0.05). and : +significantly different from Saline, Soluble Fe, Soluble Al, and Soluble Zn groups; #significantly different from Saline group; $significantly different from Soluble Fe and Saline groups; &significantly different from Saline, Soluble Fe, and Soluble Al groups. and : asignificantly different from Saline and Mix - No Ni groups; csignificantly different from Mix - No Ni group; esignificantly different from Saline, Mix – No Fe, and Mix – No Ni groups.
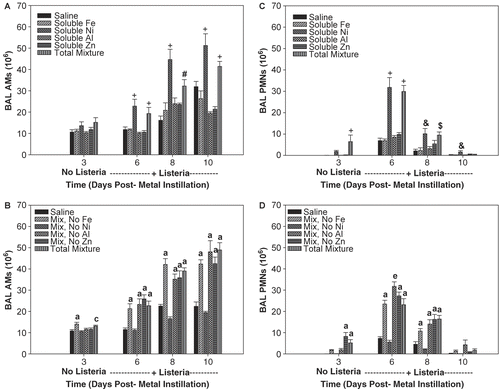
Table 4. BAL cell phenotype on Day 10 after pre-exposure to individual metals as determined by flow cytometry (3 104 Cells).
Table 5. BAL cell phenotype on Day 10 after pre-exposure to metal combinations as determined by flow cytometry (3 104 Cells).
Figure 4. Nitrate and nitrite (NOx) in the BAL fluid (BAL) of rats that were pre-exposed to individual soluble metals (A) or to soluble metal mixtures (B) 3 days prior to intratracheal inoculation with L. monocytogenes. Values are means ± SE (p < 0.05). : *significantly different from all groups; +significantly different from Saline, Soluble Fe, Soluble Al, and Soluble Zn groups. : asignificantly different from Saline and Mix - No Ni groups; csignificantly different from Mix - No Ni group.
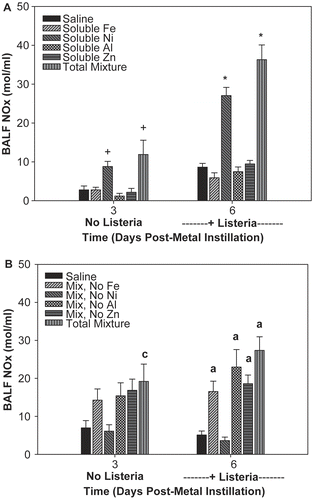
Figure 5. BAL cellular chemiluminescence (CL) depicted in total counts per 15 min for total BAL AM after stimulation with zymosan in rats that were pre-exposed to individual soluble metals (A) or to soluble metal mixtures (B) 3 days prior to intratracheal inoculation with L. monocytogenes. Values are means ± SE (p < 0.05). : *significantly different from all groups; +significantly different from Saline, Soluble Fe, Soluble Al, and Soluble Zn groups. : asignificantly different from Saline and Mix - No Ni groups; bsignificantly different from Saline group; csignificantly different from Mix - No Ni group; fsignificantly different from all groups (p < 0.05).
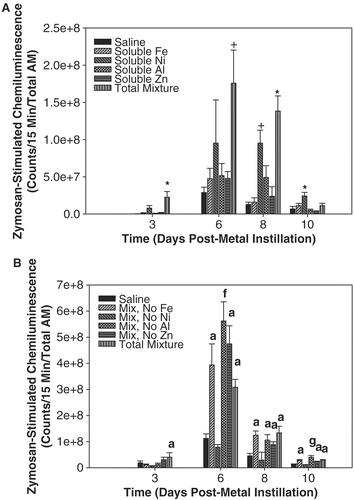
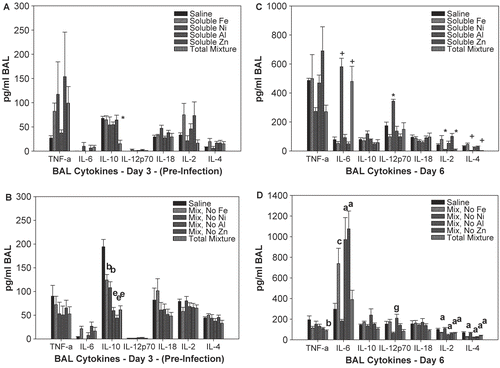
Figure 6. Cytokines involved in inflammation and the adaptive immune responses measured in the BAL fluid 3 days after intratracheal instillation with individual soluble metals (A) or soluble metal mixtures (B). Cytokines measured in the BAL fluid on Day 6 (3 days post-infection with L. monocytogenes) after intratracheal instillation with soluble metals (C) or soluble metal mixtures (D). Values are means ± SE (p < 0.05). and : *significantly different from all groups; +significantly different from Saline, Soluble Fe, Soluble Al, and Soluble Zn groups. and : asignificantly different from Saline and Mix - No Ni groups; bsignificantly different from Saline group; csignificantly different from Mix - No Ni group; esignificantly different from Saline, Mix – No Fe, and Mix – No Ni groups; gsignificantly different from Saline, Mix - No Fe, and Mix - No Al groups.